HTTP 200 OK
Allow: GET, HEAD, OPTIONS
Content-Type: application/json
Vary: Accept
[
{
"id": 16,
"slug": "280-1733444100",
"type": "review_article",
"manuscript_id": "280-1733444100",
"published": "2025-01-25",
"journal_reference": "Plant Trends. 2025; 3(1): 01-12",
"academic_editor": "Md. Azizul Haque, PhD; Hajee Mohammad Danesh Science and Technology University, Bangladesh",
"cite_info": "Das K, Sarker A, et al. Harnessing plant–microorganism interactions for nano-bioremediation of heavy metals: Cutting-edge advances and mechanisms. Plant Trends. 2025; 3(1): 01-12.",
"title": "Harnessing plant–microorganism interactions for nano-bioremediation of heavy metals: Cutting-edge advances and mechanisms",
"DOI": "10.5455/pt.2025.01",
"figures": [
{
"figure": "https://plant-trends.bsmiab.org/media/article_images/2025/46/02/280-1733444100-Figure1.jpg",
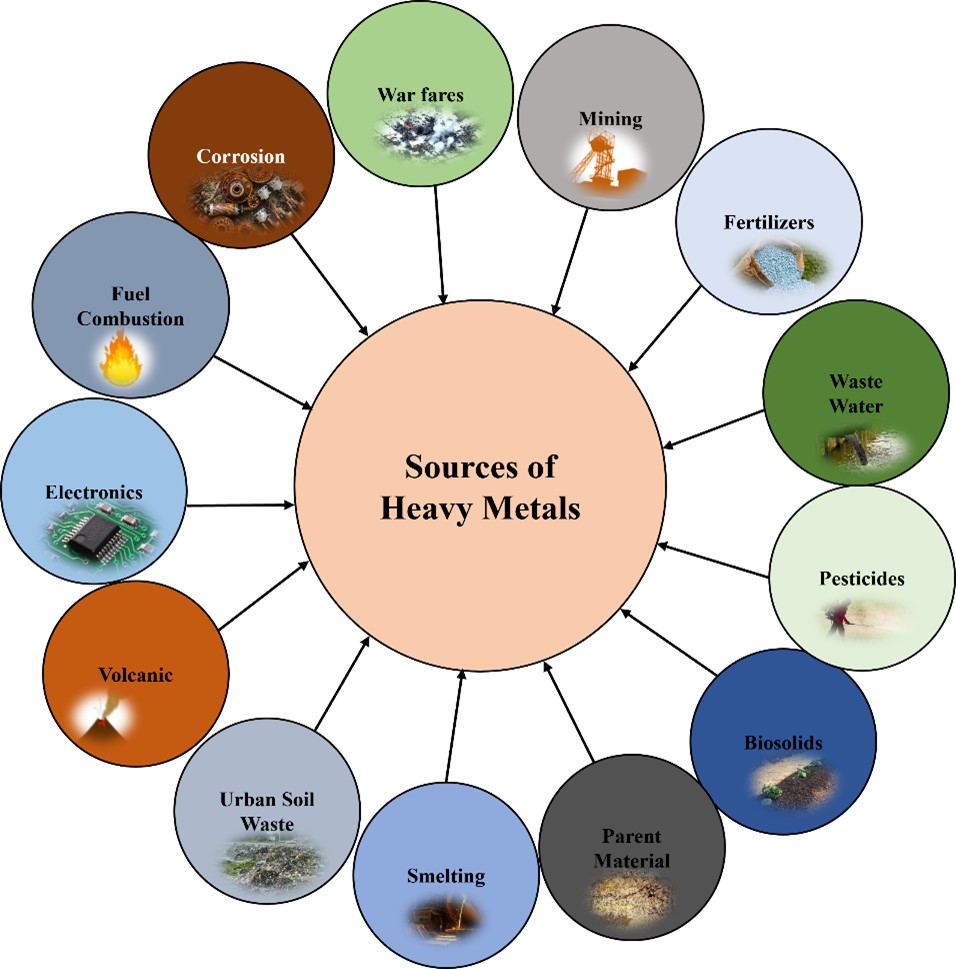
"caption": "Figure 1. Sources of HMs in the environment. The figure illustrates the various anthropogenic and natural sources of heavy metals, such as industrial discharge, agricultural runoff, natural mineral deposits, soil waste and toxic chemicals.",
"featured": false
},
{
"figure": "https://plant-trends.bsmiab.org/media/article_images/2025/46/02/280-1733444100-Figure2.jpg",
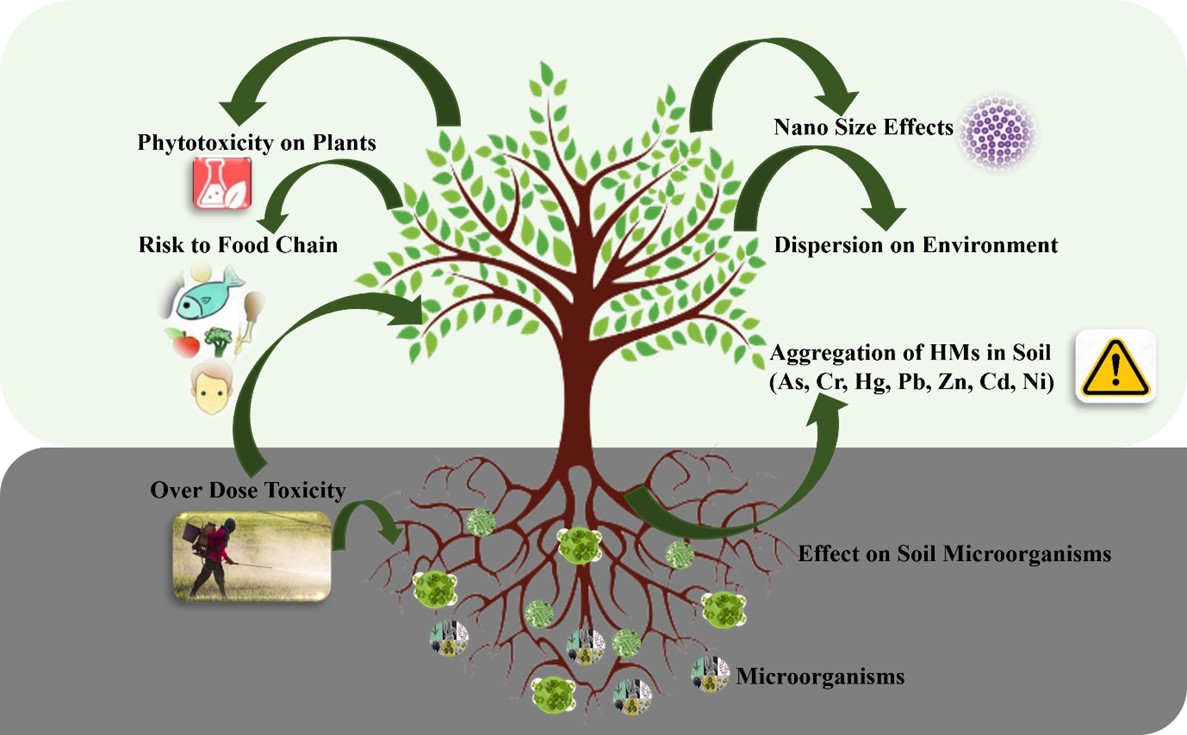
"caption": "Figure 2. Toxicity of HMs in plants, soil, and environment. The figure represents the toxic effects of HMs on plant physiology, soil fertility, and overall environmental health. The figure highlights specific mechanisms of toxicity such as disruption of enzymatic activities and oxidative stress in plants, alongside soil degradation.",
"featured": true
},
{
"figure": "https://plant-trends.bsmiab.org/media/article_images/2025/46/02/280-1733444100-Figure3.jpg",
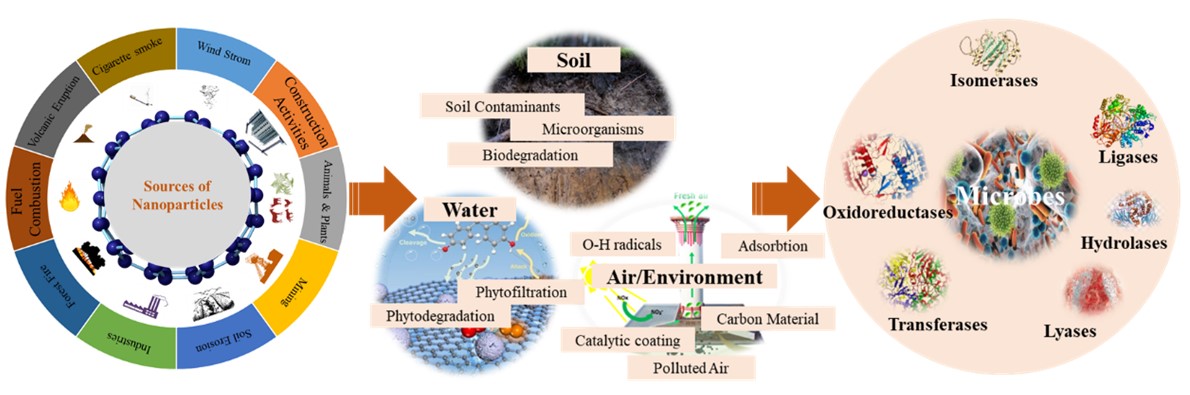
"caption": "Figure 3. Role of nanoparticles in environmental clean-up. The figure depicts the sources of nanoparticles and their mechanisms of action in remediation of contaminated soil, water, and air/environment. It outlines the enzymatic processes involved and the effectiveness of various nanoparticles in sequestering or degrading heavy metal pollutants. These extended captions provide a comprehensive description of each figure, ensuring that readers can fully understand the implications and contexts of the visual data presented.",
"featured": false
}
]
},
{
"id": 15,
"slug": "280-1722352436",
"type": "original_article",
"manuscript_id": "280-1722352436",
"published": "2024-12-05",
"journal_reference": "Plant Trends. 2024; 2(4): 92-107.",
"academic_editor": "Izhar Ali, PhD, Guangxi University, China",
"cite_info": "Ahmed T, Rahman MS, et al., Utilization of endophytic bacteria for liquid biofertilizer production with a newly designed prototype fermentor for plant improvement. Plant Trends. 2024 Dec; 2(4): 92-107.",
"title": "Utilization of endophytic bacteria for liquid biofertilizer production with a newly designed prototype fermentor for plant improvement",
"DOI": "10.5455/pt.2024.08",
"figures": [
{
"figure": "https://plant-trends.bsmiab.org/media/article_images/2024/25/17/280-1722352436-Figure1.jpg",
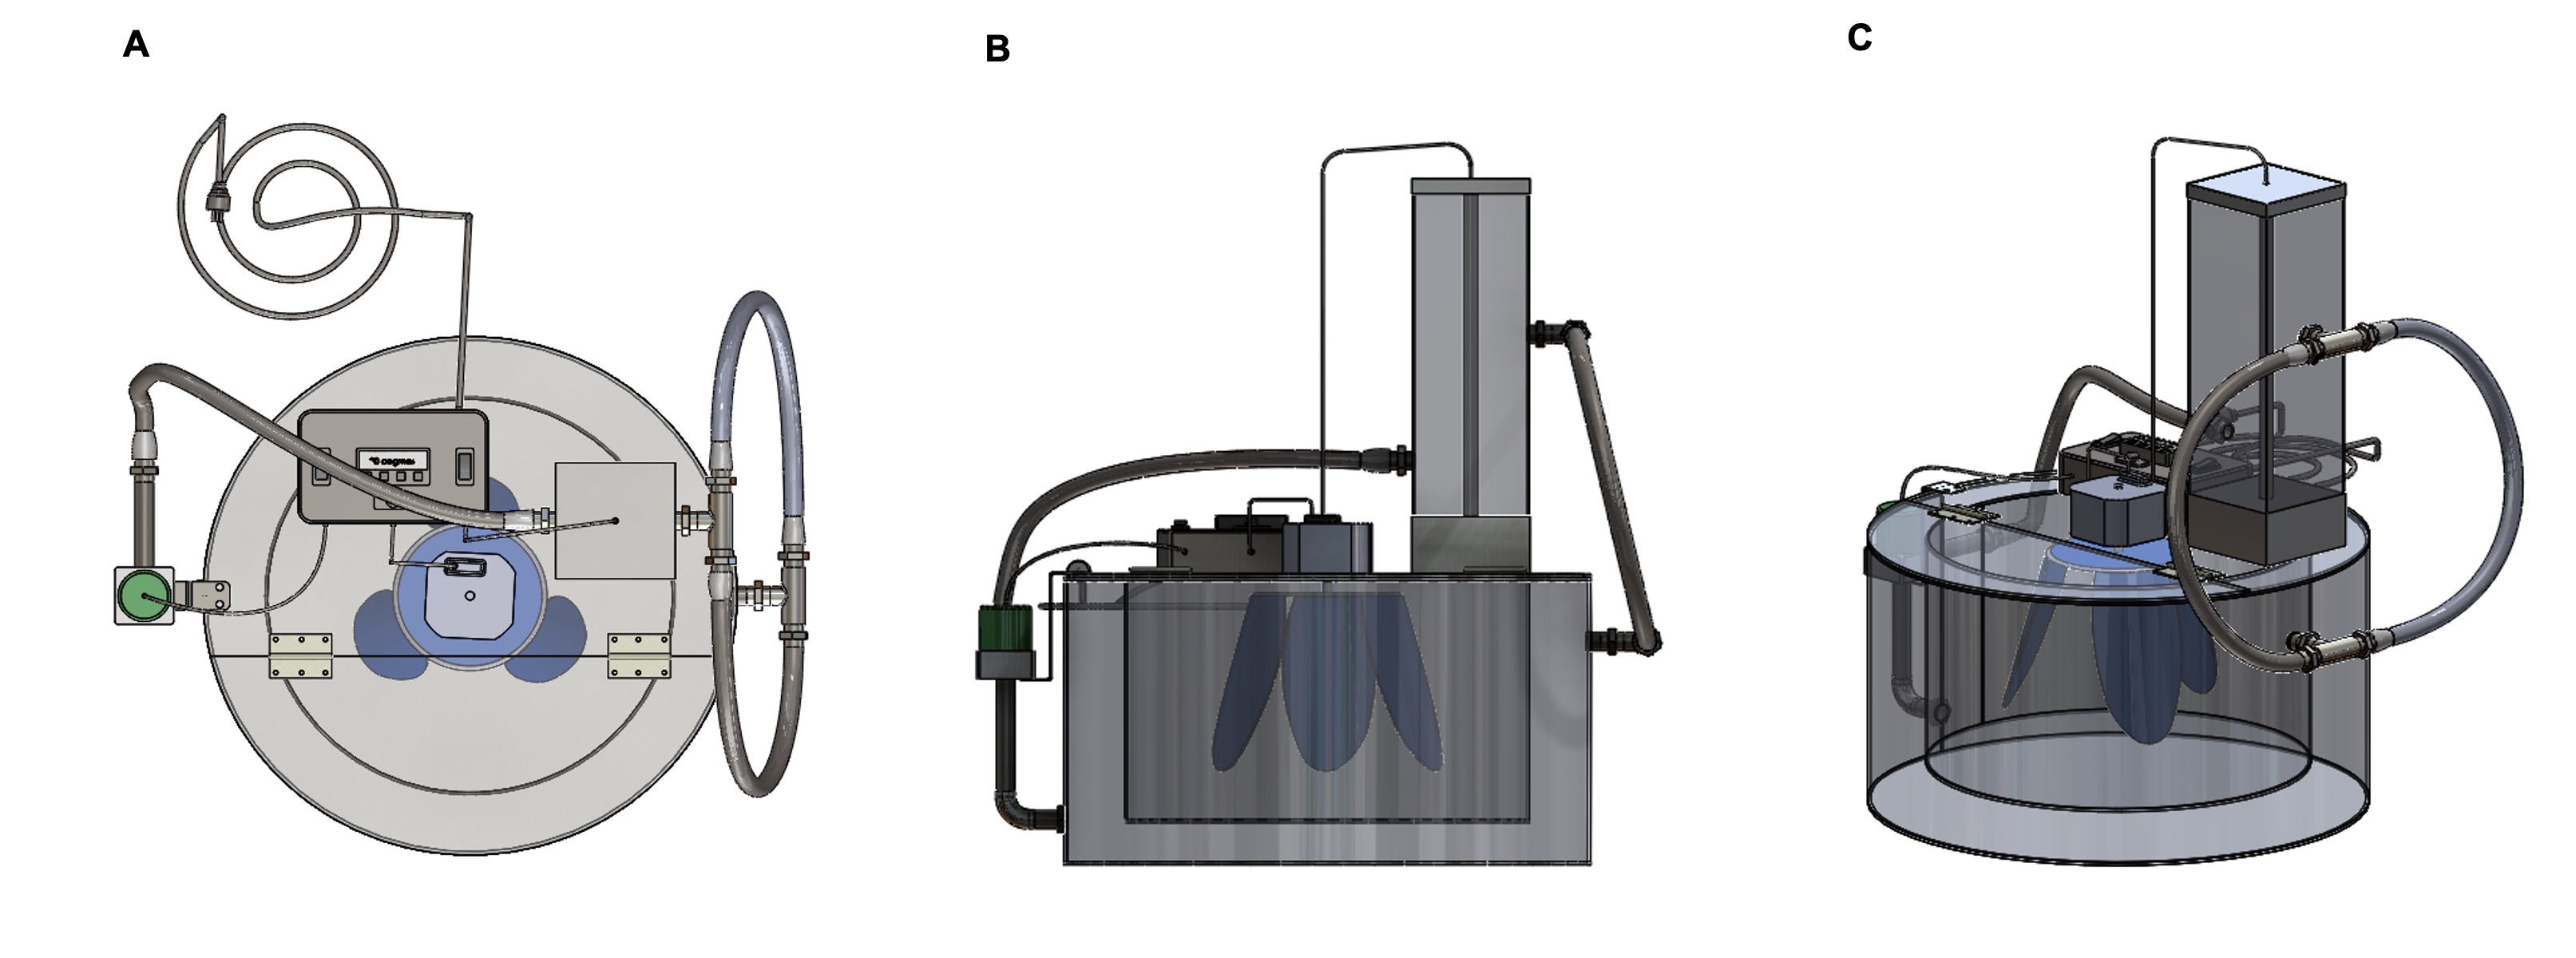
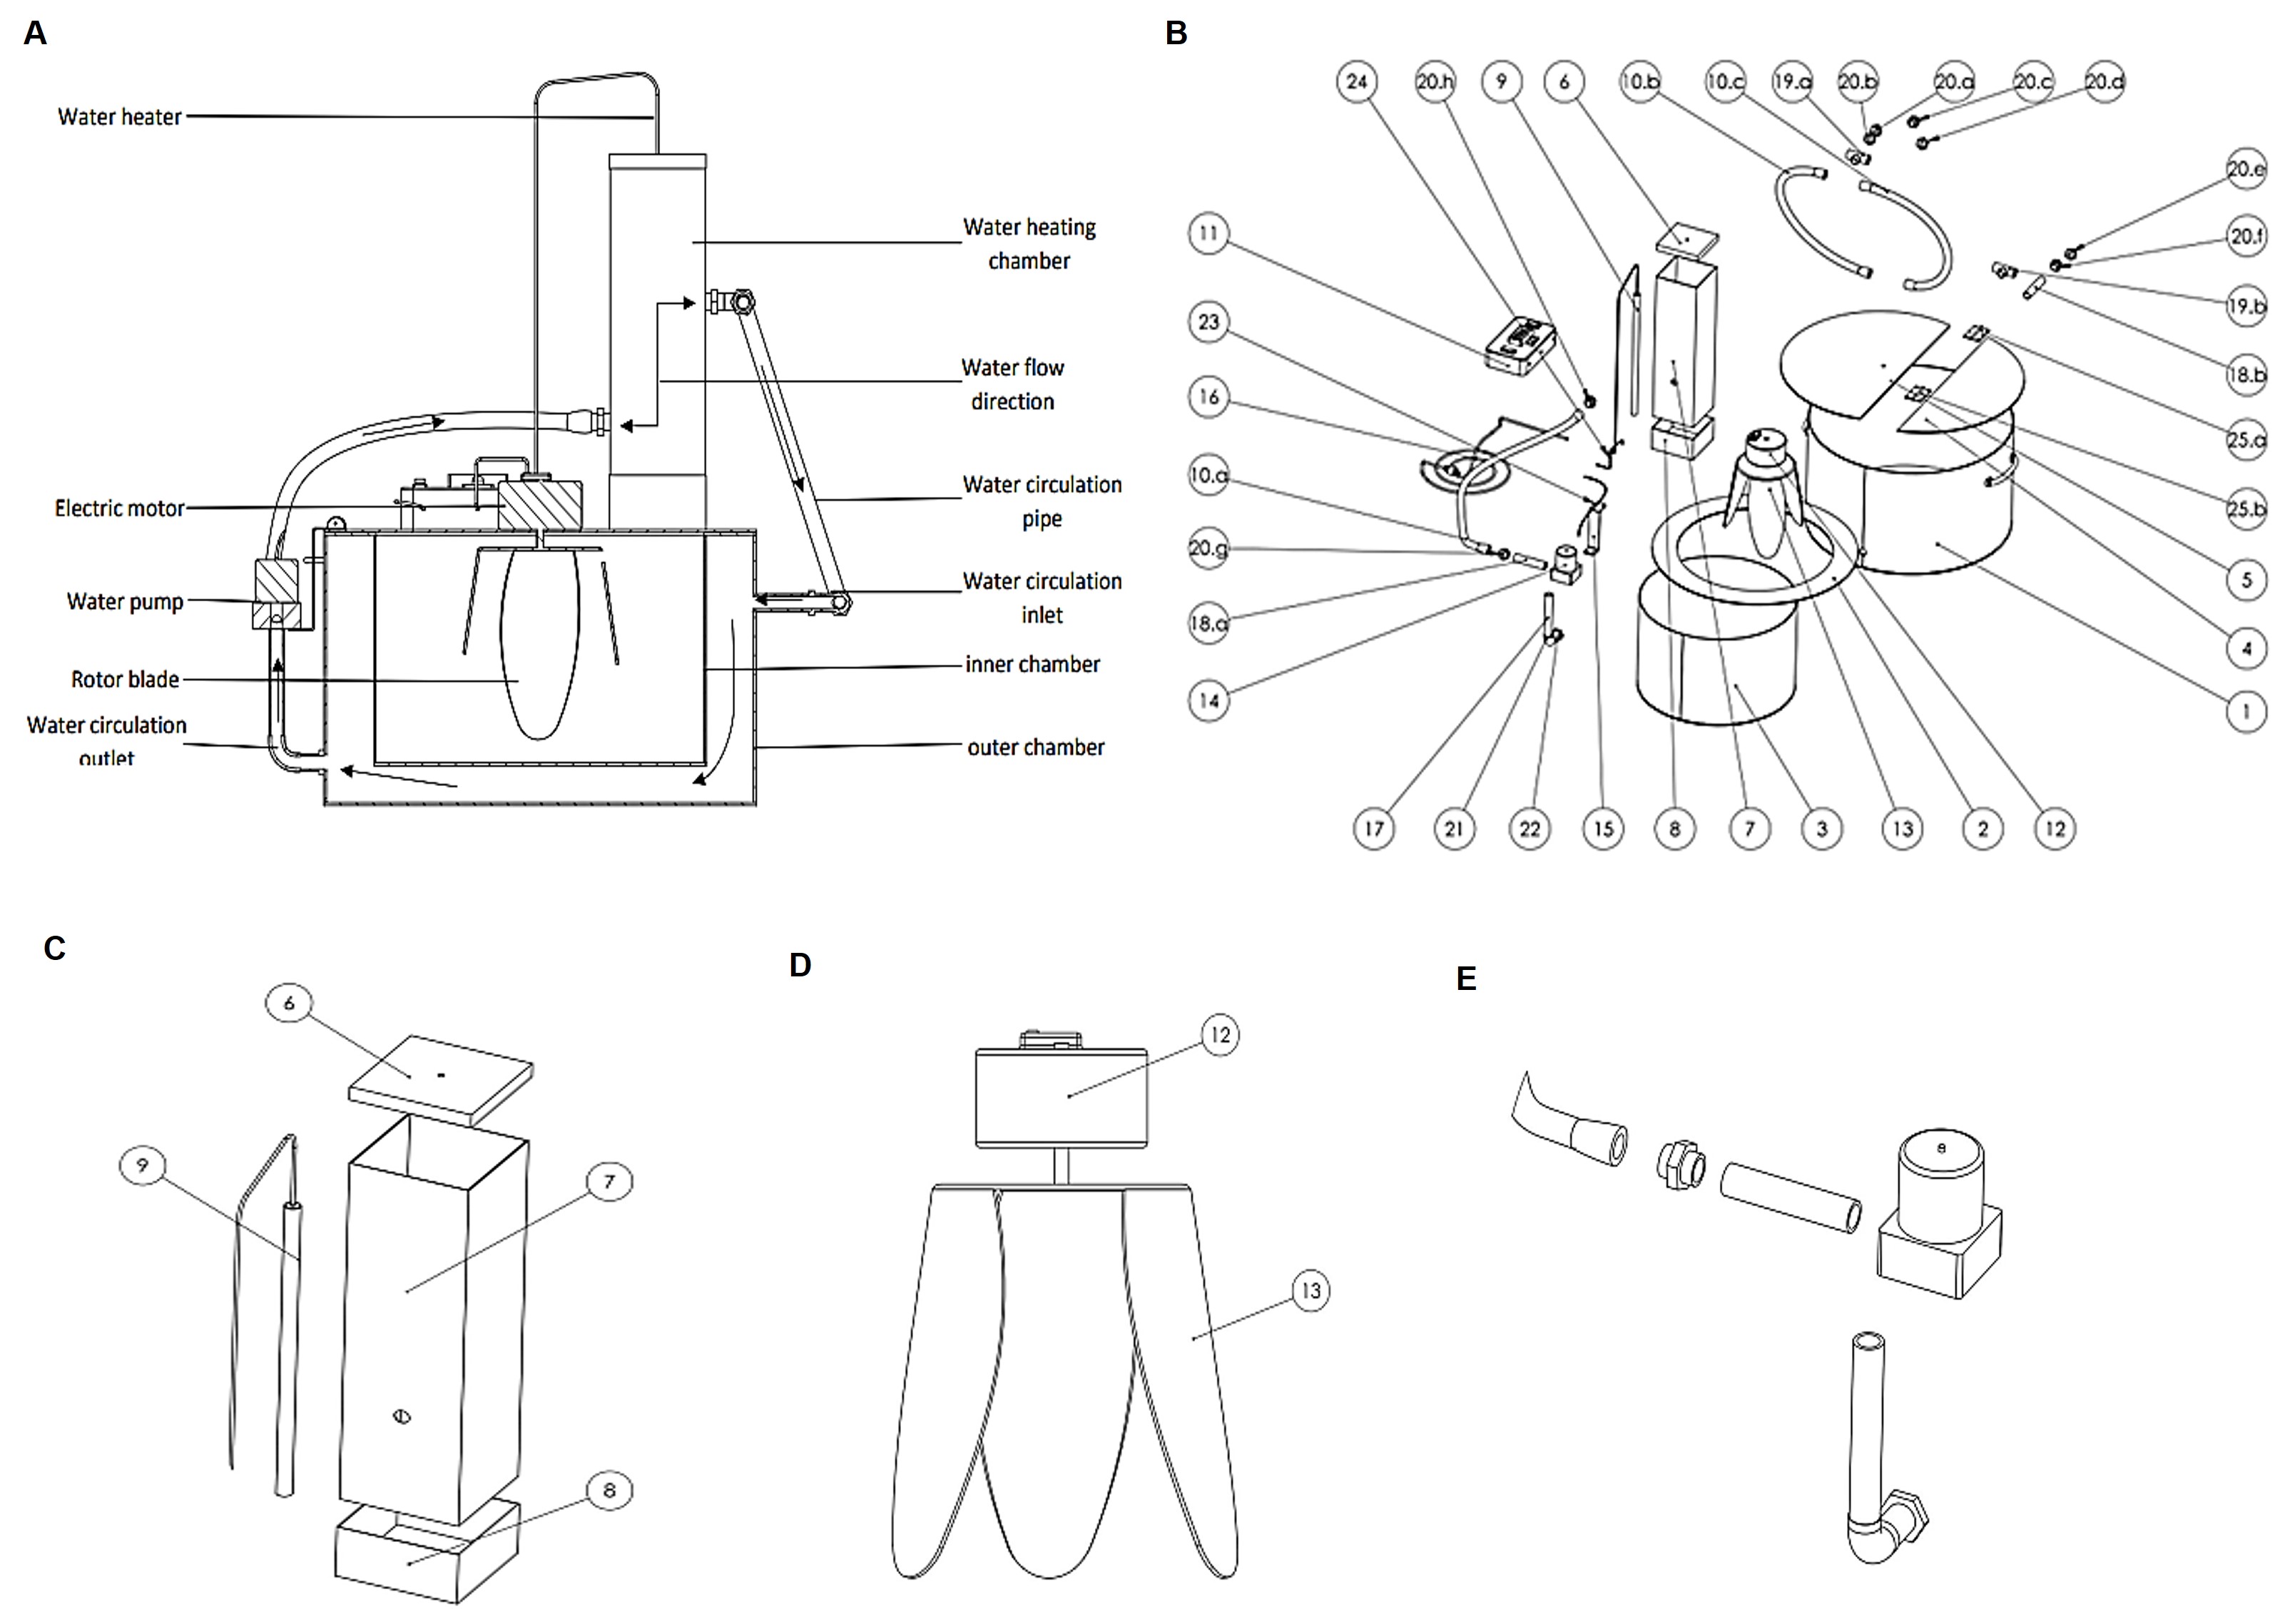
"caption": "Figure 1. Transparent CAD Model – the assemblage of the fermentor with bacterial growth chamber and rotary motion (Designed in SolidWorks V2021). A) Top view, B) Front view, and C) Dimetric view of the fermentor.",
"featured": false
},
{
"figure": "https://plant-trends.bsmiab.org/media/article_images/2024/25/17/280-1722352436-Figure2.jpg",
"caption": "Figure 2. 2D drawing of the fermentor (Designed in SolidWorks 2021). A) Cross-sectional view that is consistent with the patent image [33], B) Detailed sketch with an exploded view marking each component with a number, C) Water heating chamber with heater and lid, D) Rotor blade/ Agitator with motor, and E) Water circulating pump of the fermentor [33].",
"featured": false
},
{
"figure": "https://plant-trends.bsmiab.org/media/article_images/2024/25/17/280-1722352436-Figure3.jpg",
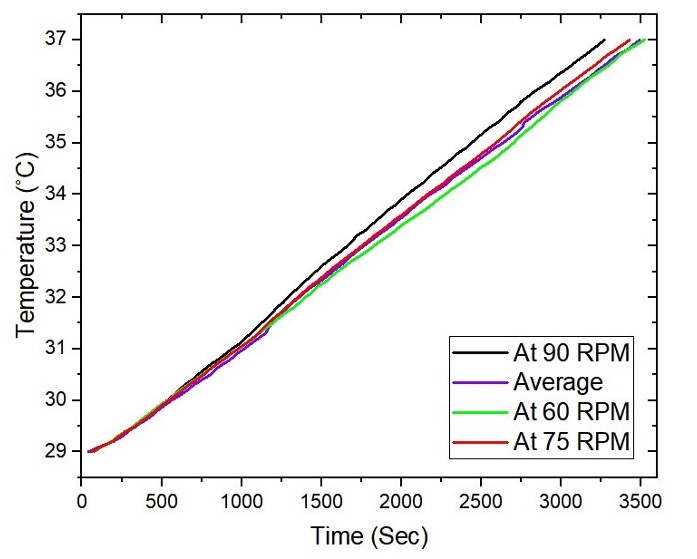
"caption": "Figure 3. Effect of RPM level on chamber temperature elevation. Temperature increases over time by the agitator/blade speed, operating at 60 RPM, 75 RPM, or 90 RPM to reach from 29°C to the required temperature of 37°C. Abbreviation, RPM, rotation per minute.",
"featured": false
},
{
"figure": "https://plant-trends.bsmiab.org/media/article_images/2024/25/17/280-1722352436-Figure4.jpg",
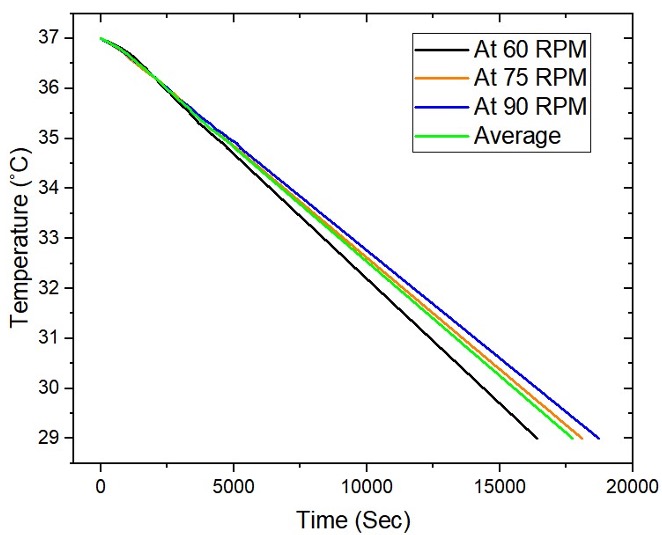
"caption": "Figure 4. Effect of RPM level on chamber temperature reduction. Temperature decreases over time by the agitator/blade speed, operating at 60 RPM, 75 RPM, or 90 RPM to cool down the temperature from 37°C to the initial temperature of 29°C. RPM, rotation per minute.",
"featured": false
},
{
"figure": "https://plant-trends.bsmiab.org/media/article_images/2024/25/17/280-1722352436-Figure5.jpg",
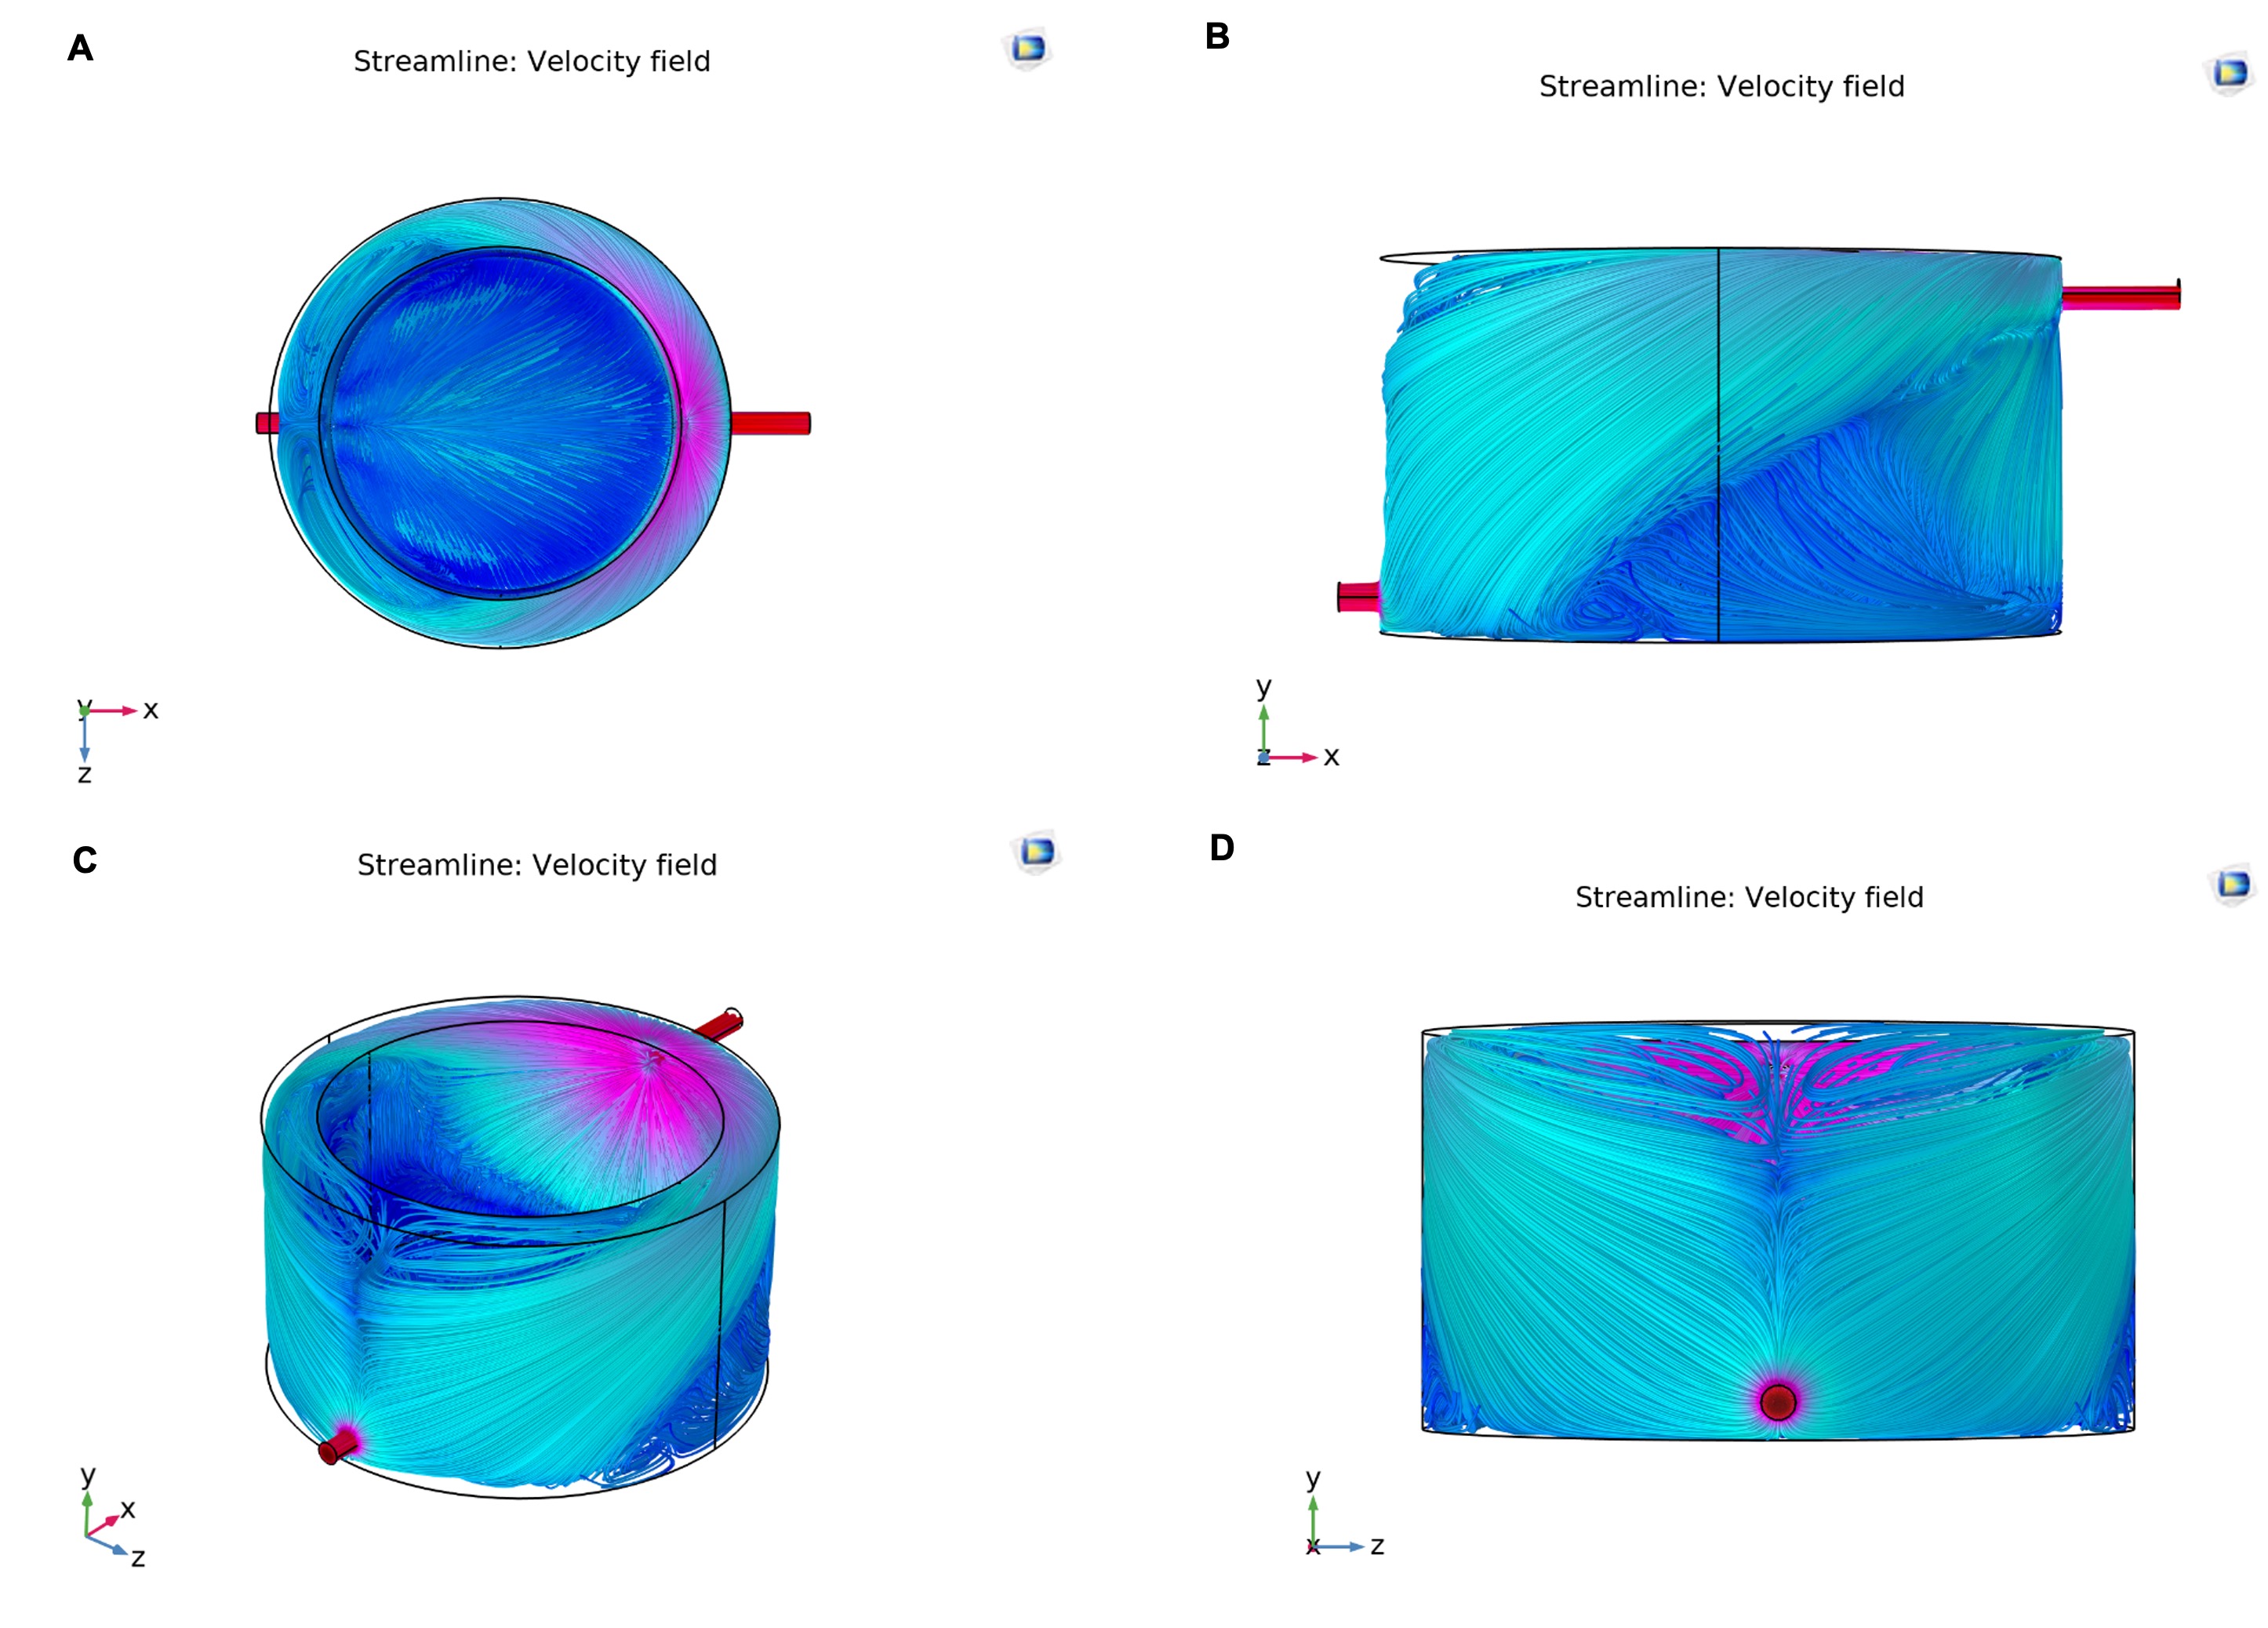
"caption": "Figure 5. The streamline of the circulating water around the inner chamber/growth chamber (Turbulent flow K-ɷ spf, Simulated in Comsol Multiphysics V6.0). A) Top view, B) Front view, C) Isometric view, and D) Side view of the fermentor.",
"featured": false
},
{
"figure": "https://plant-trends.bsmiab.org/media/article_images/2024/25/17/280-1722352436-Figure6.jpg",
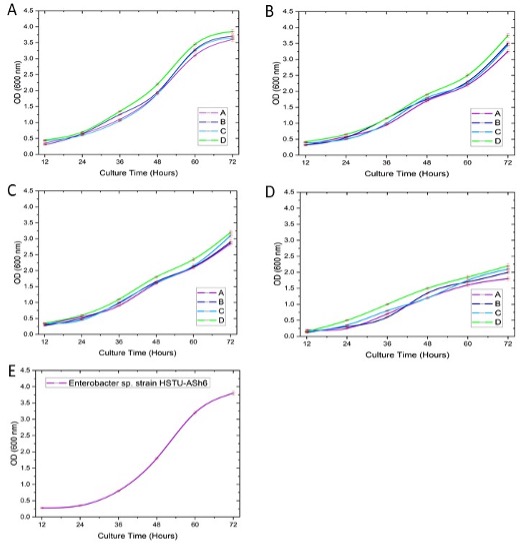
"caption": "Figure 6. The growth rate of consortia A, B, C, and D. A) Growth medium containing tryptic soya broth (TSB=5.0 g) and yeast extract (5 g), OD = 10 g, volume = 25 liters; B) Growth medium containing only tryptic soya broth (TSB= 5.0 g), OD = 10 g, volume = 25 liters; C) Growth medium containing only yeast extract, OD = 5.0 g, volume = 25 liters; D) Growth medium without consisting of TSB and Yeast extract. OD = 10 g, volume = 25 liters; E) Growth rate of Enterobacter sp. strain HSTU-ASh6 in medium containing tryptic soya broth (TSB=5.0 g) and yeast extract (5 g), OD = 10 g, volume = 25 liters.",
"featured": false
},
{
"figure": "https://plant-trends.bsmiab.org/media/article_images/2024/25/17/280-1722352436-Figure7.jpg",
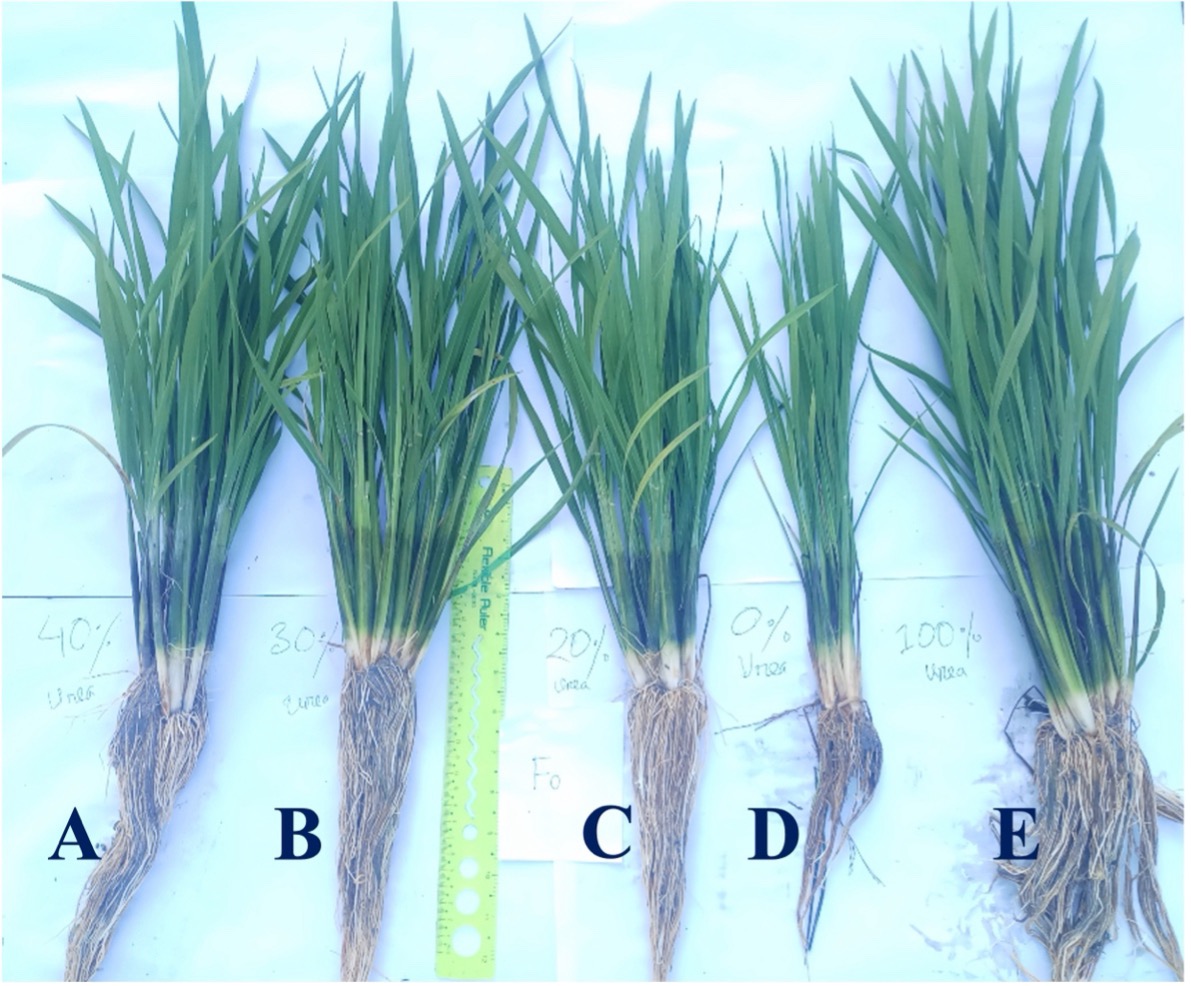
"caption": "Figure 7. Growth performance of amplified biofertilizer consortia A on rice plants (var. BRRI dhan28) in field conditions with reduced urea fertilizer. The morphology of rice plants was attained with A) 40%, B) 30%, C) 20%, D) 0%, and E) 100% of the recommended dose of urea, respectively, where bacterial consortia A were applied twice in the treatments A, B, and C.",
"featured": true
}
]
},
{
"id": 13,
"slug": "280-1711854419",
"type": "review_article",
"manuscript_id": "280-1711854419",
"published": "2024-09-25",
"journal_reference": "Plant Trends. 2024; 2(3): 74-91",
"academic_editor": "Monirul Islam, PhD; University of Massachusetts Amherst Amherst, USA",
"cite_info": "Plant improvement and metabolite production in Cannabis sativa: Recent biotechnological advances. Plant Trends. 2024 Sep; 2(3): 74-91.",
"title": "Plant improvement and metabolite production in <span>Cannabis sativa</span>: Recent biotechnological advances",
"DOI": "10.5455/pt.2024.07",
"figures": [
{
"figure": "https://plant-trends.bsmiab.org/media/article_images/2024/19/01/280-1711854419-Figure1.jpg",
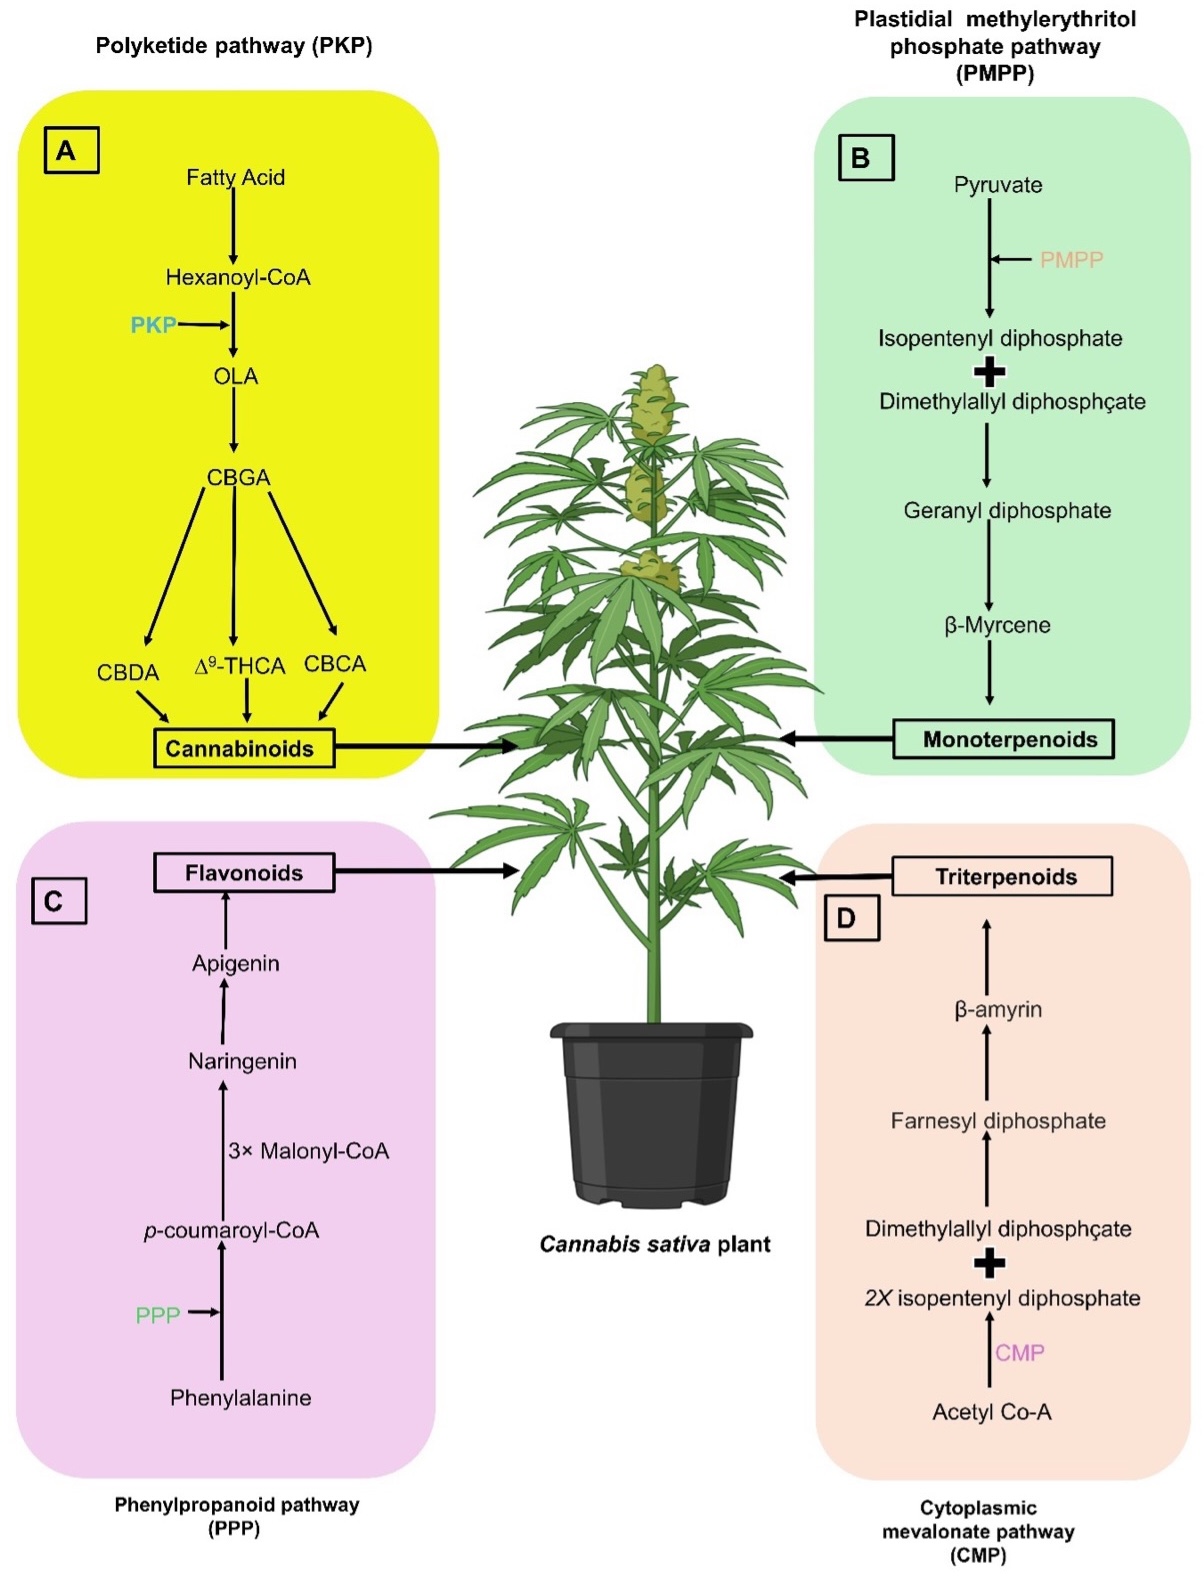
"caption": "Figure 1. Biosynthetic pathways of secondary metabolites production in Cannabis sativa. The cannabinoids, terpenoids, and flavonoids are produced in Cannabis. Glandular trichomes, located on the aerial parts and female flowers, serve as production and storage sites for cannabinoids and terpenoids. Cannabinoid synthesis involves olivetolic acid (OLA), from the polyketide pathway, and geranyl diphosphate (GPP), from the deoxyxylulose phosphate/methyl-erythritol phosphate (DOXP/MEP) pathway, as key precursors. Terpenoids, such as monoterpenoids, sesquiterpenoids, and triterpenoids are produced via the Plastidial mevalonate (MVA) or DOXP/MEP pathways (PMPP) or cytoplasmic mevalonate pathway (CMP). The main flavonoid classes, flavones and flavonols, are synthesized in Cannabis sativa through the phenylpropanoid pathway (PPP), converting phenylalanine to p-coumaroyl-CoA.",
"featured": false
},
{
"figure": "https://plant-trends.bsmiab.org/media/article_images/2024/19/01/280-1711854419-Figure2.jpg",
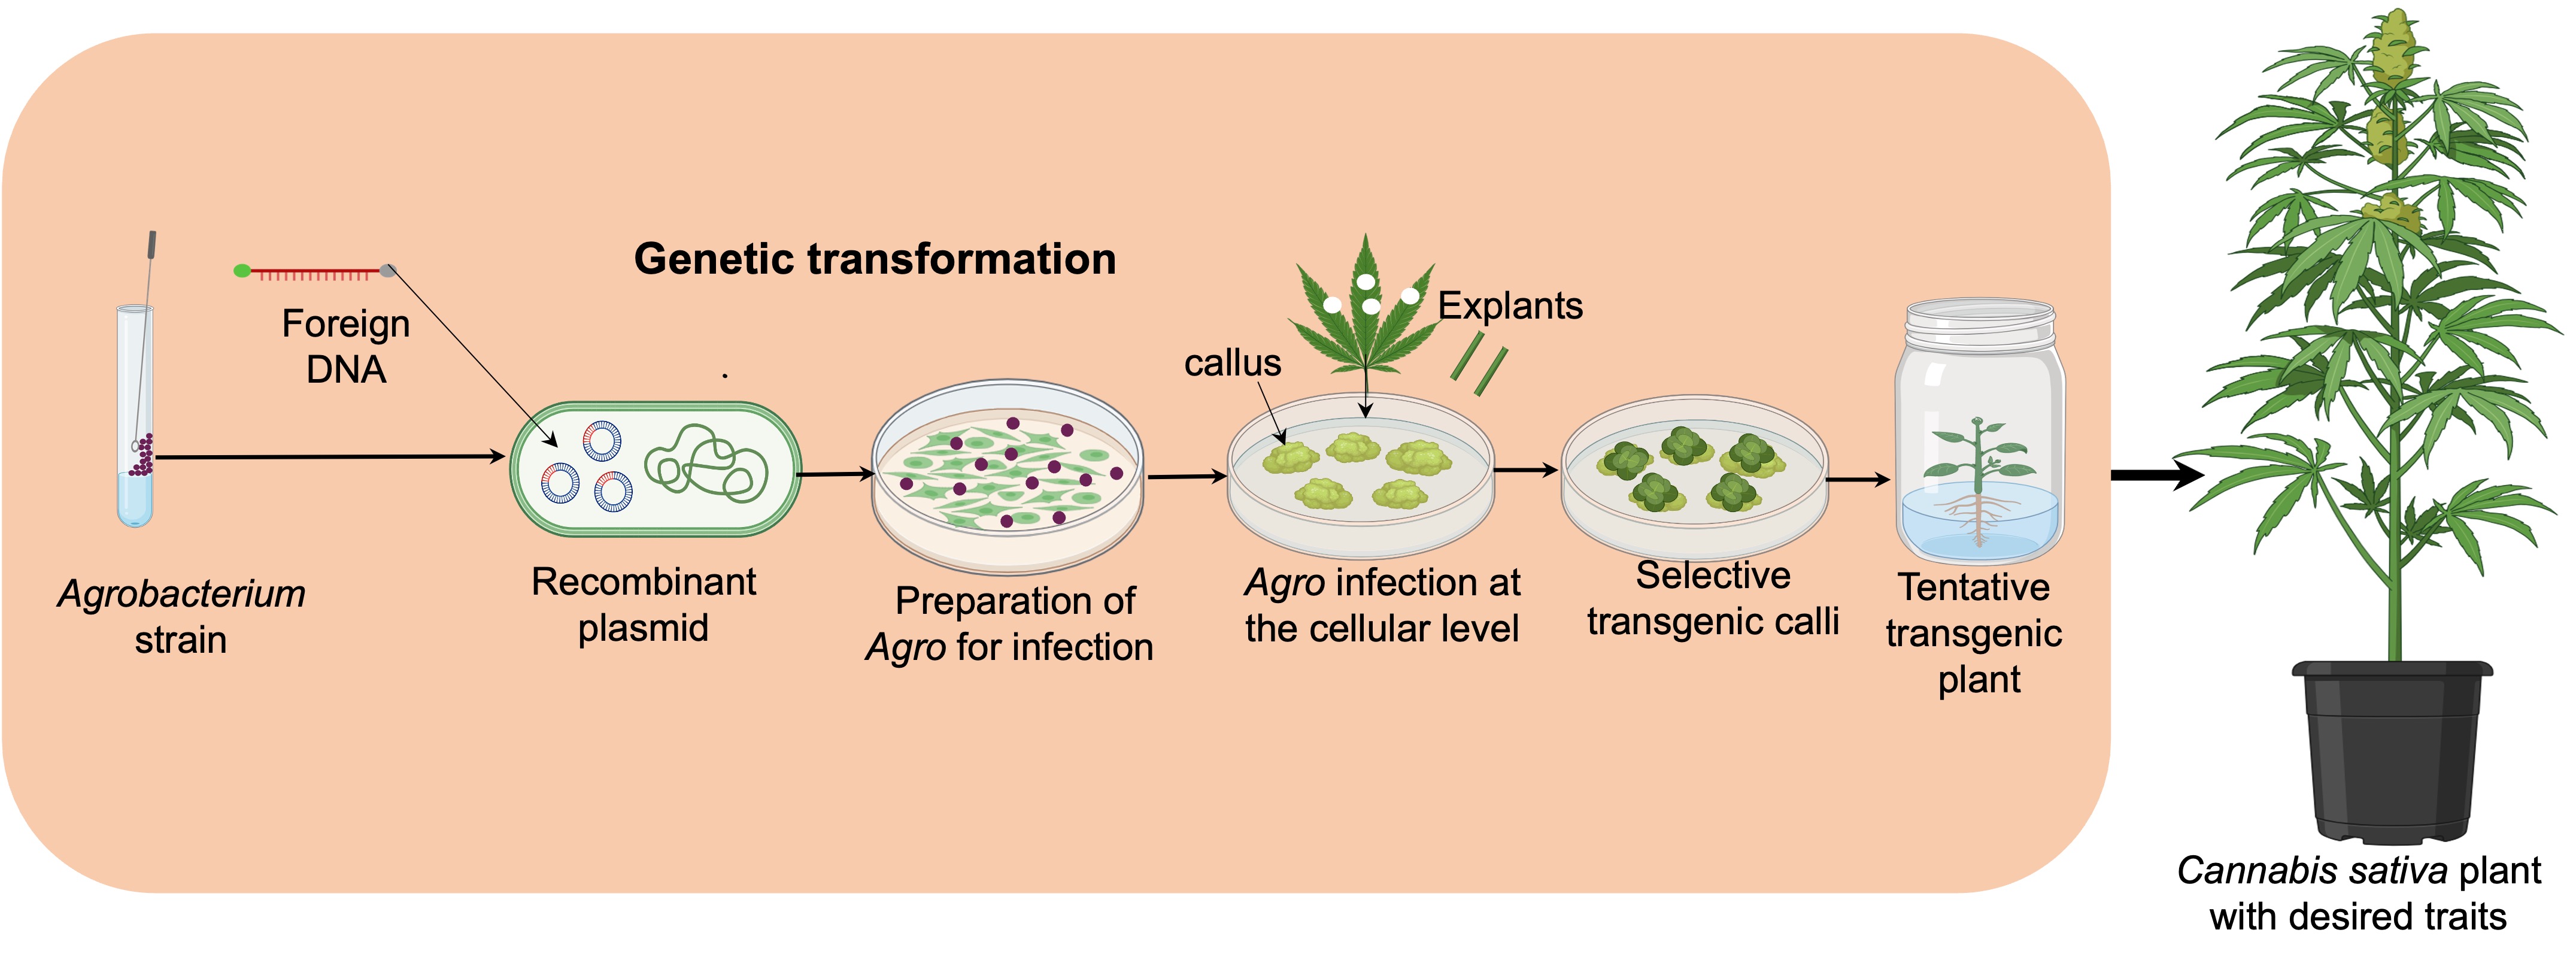
"caption": "Figure 2. The schematic representation of Agrobacterium-mediated gene transformation. In this process, the induction of de novo meristems (such as callus formation resembling in vitro plantlets, as well as callus-derived shoot and root regeneration) is essential. These steps are directly linked to plant tissue culture, which is critical for successful transfection.",
"featured": false
},
{
"figure": "https://plant-trends.bsmiab.org/media/article_images/2024/19/01/280-1711854419-Figure3.jpg",
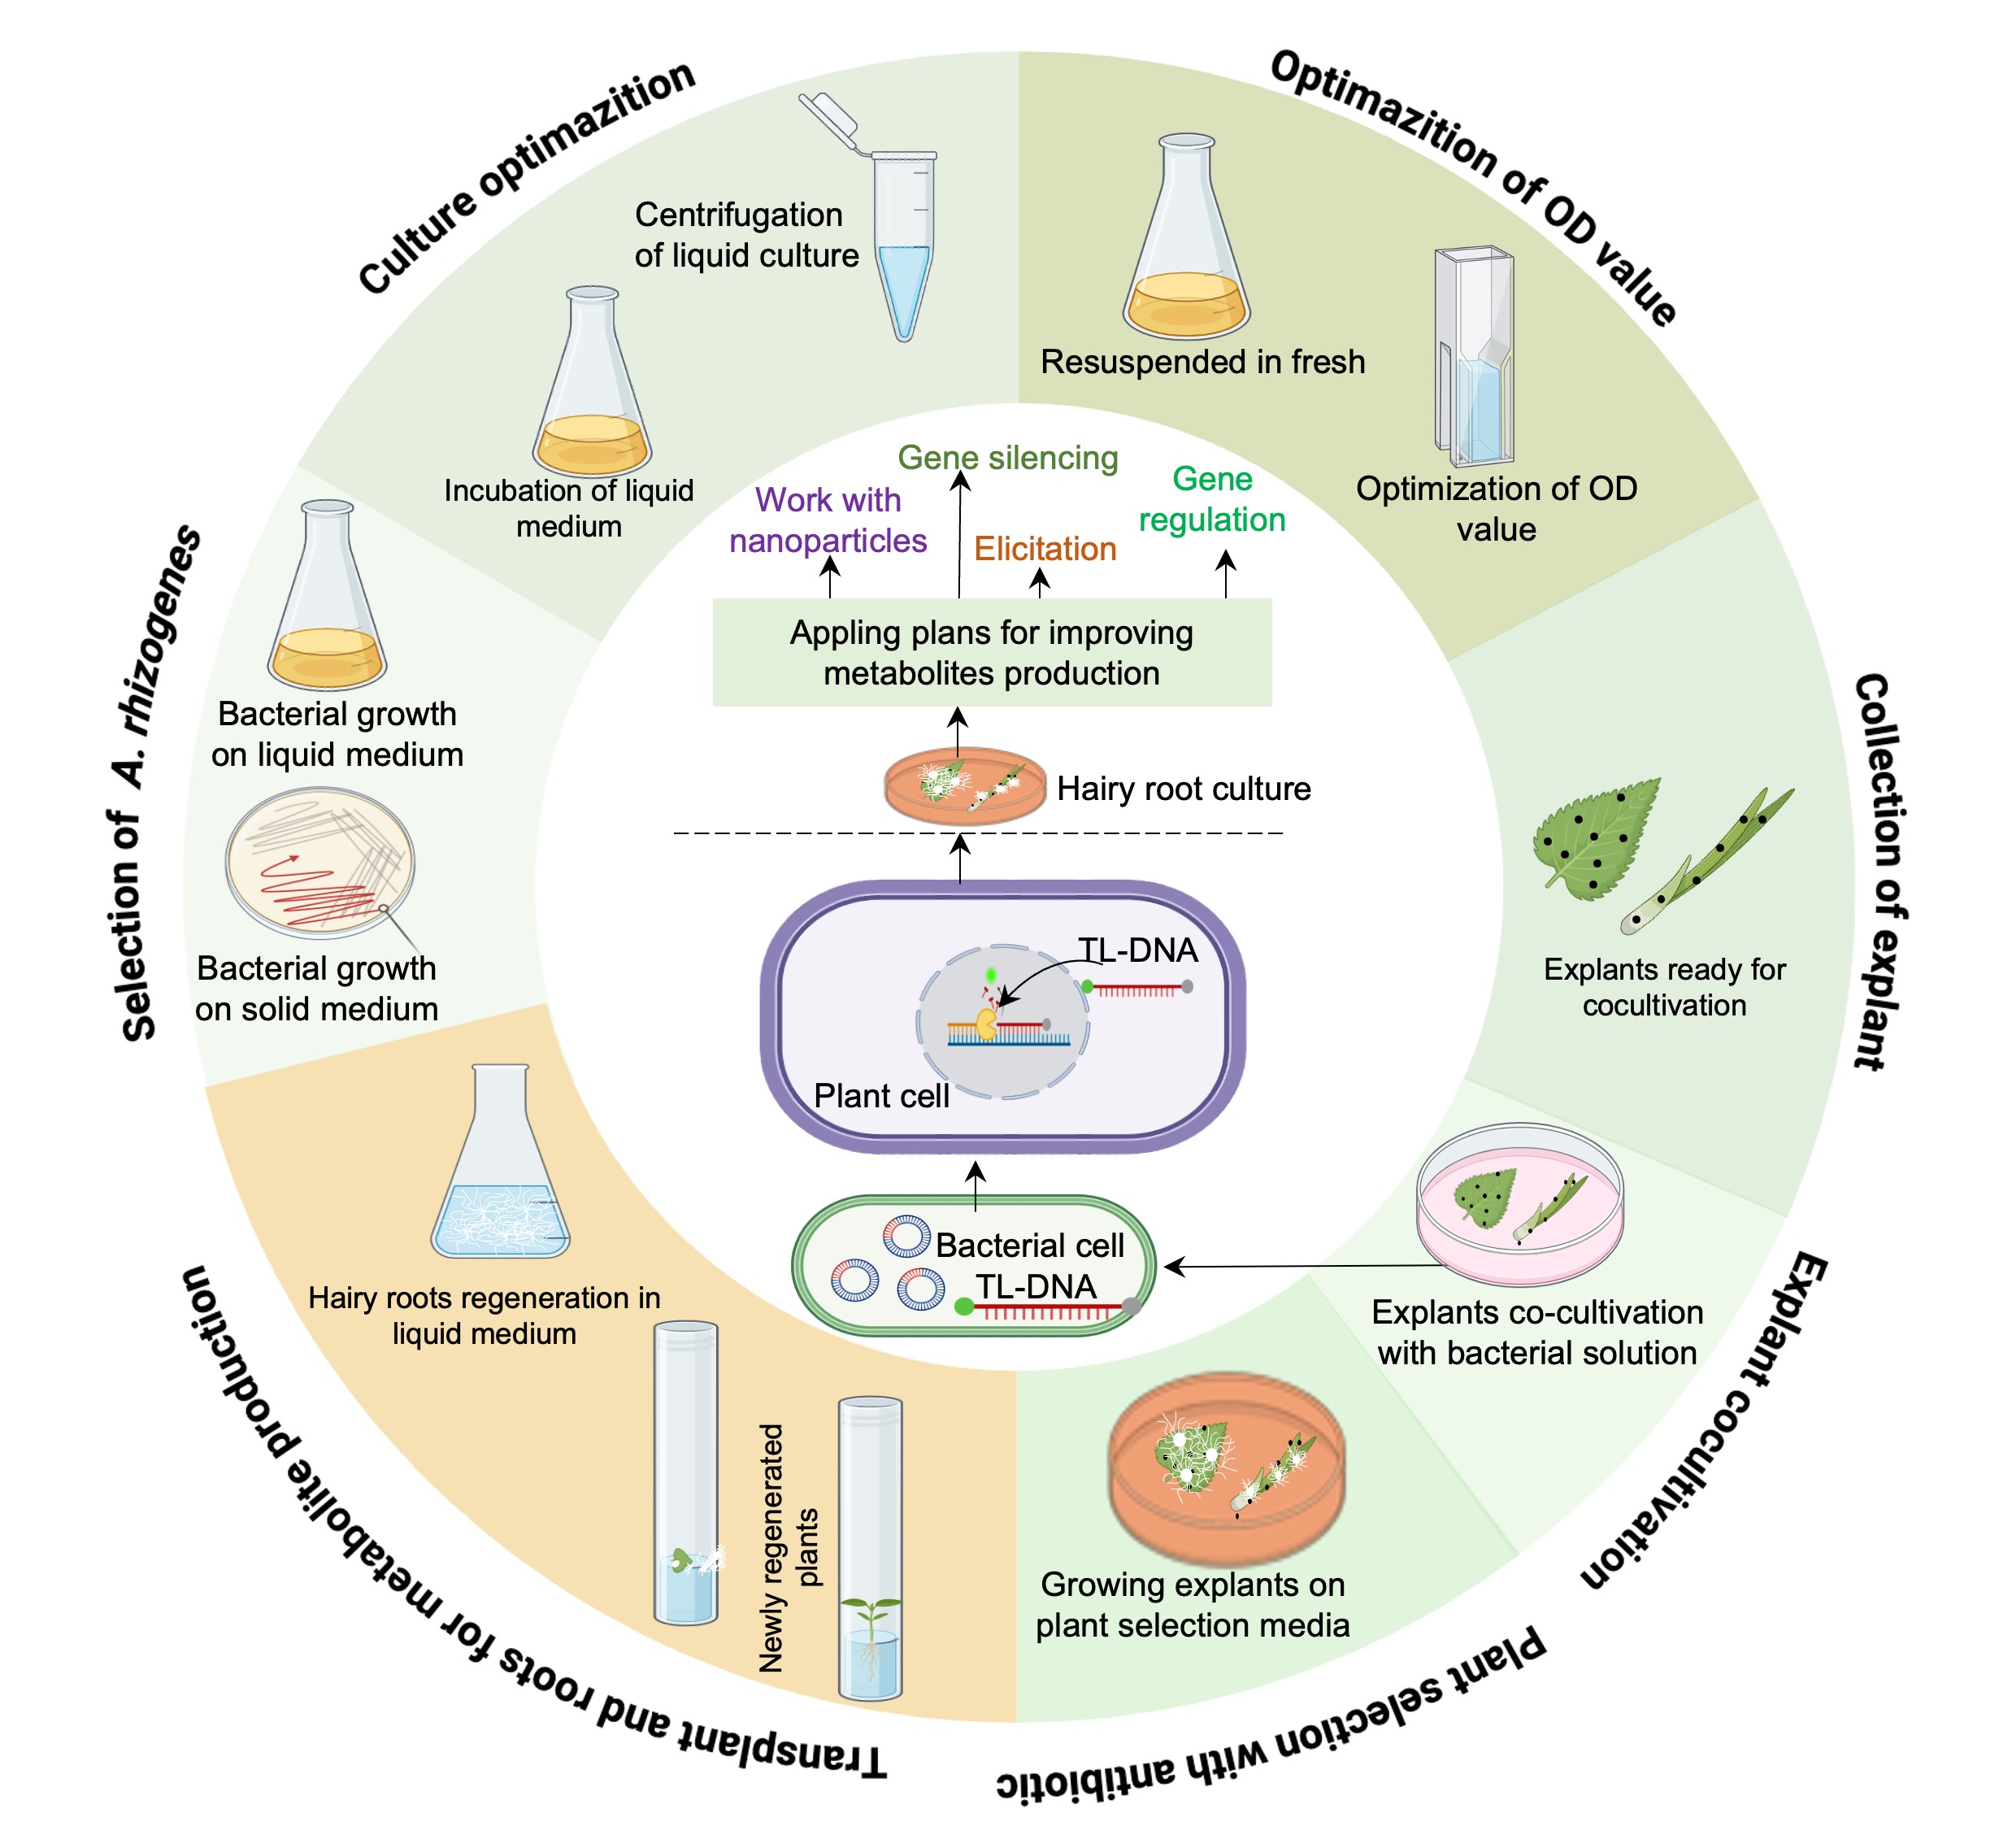
"caption": "Figure 3. Agrobacterium rhizogenes mediated genetic modification for improving plants and metabolite production. The infection process begins when the bacterium is attracted to a plant's wounded site through chemotaxis. It then penetrates the plant tissue, transferring TL-DNA (such as rolA, rolB, rolC, and rolD genes) into the plant genome. This transfer is facilitated by the virulence (vir) genes on the Ri-plasmid and the chv genes on the bacterial chromosomal DNA. Once integrated, the TL-DNA promotes the production of phytohormones like auxin and cytokinin, leading to the development of the characteristic hairy roots.",
"featured": false
},
{
"figure": "https://plant-trends.bsmiab.org/media/article_images/2024/13/07/Figure_4.jpeg",
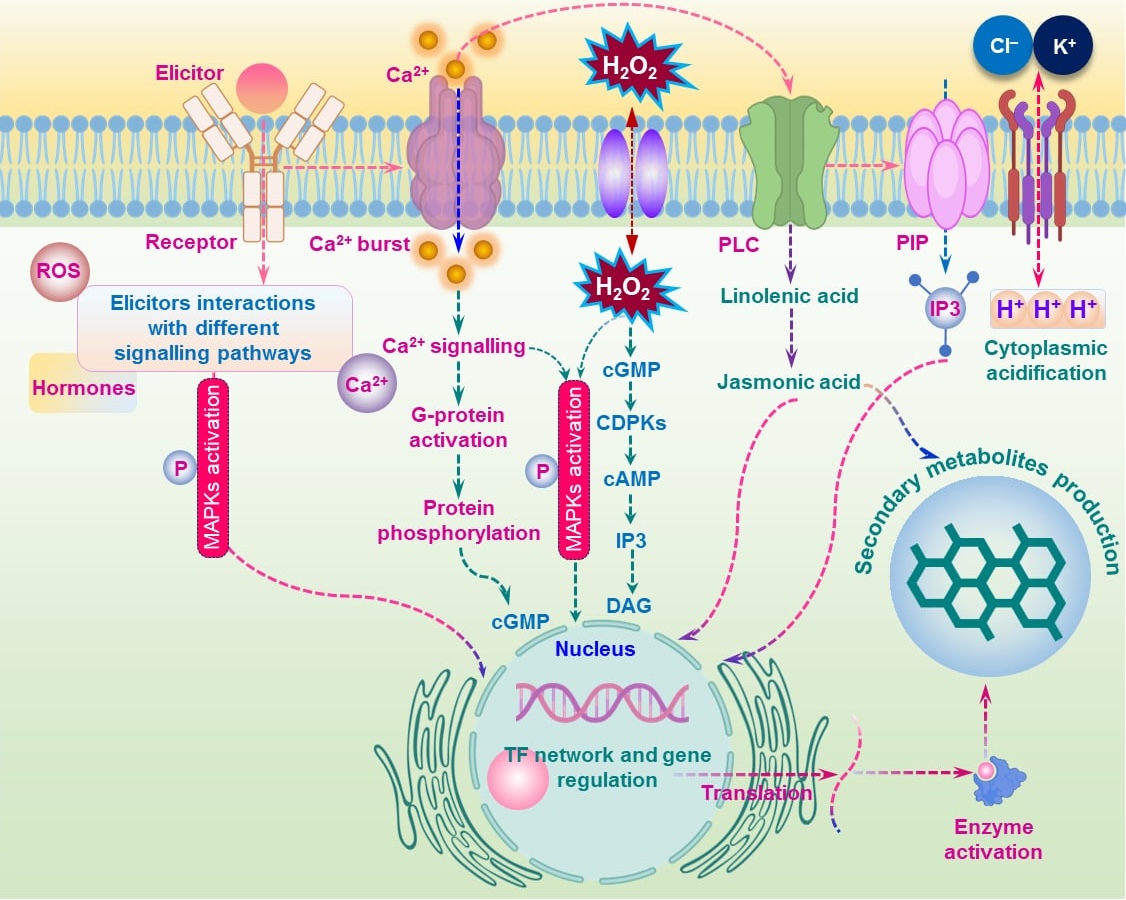
"caption": "Figure 4. Mechanism of elicitor-triggered signal transduction pathways leading to the synthesis of plant secondary metabolites. The elicitors, such as reactive oxygen species (ROS) and plant hormones, interact with specific receptors located on the plasma membrane, initiating multiple signaling pathways. Upon receptor activation, a rapid influx of calcium ions (Ca²⁺ burst) occurs, which is crucial for initiating intracellular signal transduction. The Ca²⁺ ions activate G-proteins, leading to downstream protein phosphorylation and mitogen-activated protein kinase (MAPK) activation. H₂O₂, a key reactive oxygen species, is generated and acts as a secondary messenger in elicitor-induced signaling, playing a role in the activation of calcium-dependent protein kinases (CDPKs), cyclic GMP (cGMP), cyclic AMP (cAMP), and phosphoinositide signaling pathways, which further enhance MAPK activation. Phospholipase C (PLC) is activated, resulting in the cleavage of phosphatidylinositol bisphosphate (PIP₂) to generate inositol trisphosphate (IP₃) and diacylglycerol (DAG). IP₃ mediates the release of Ca²⁺ from intracellular stores, reinforcing the calcium signaling cascade. Jasmonic acid, derived from linolenic acid, is also produced via this pathway and plays a role in the regulation of secondary metabolite production. The figure highlights the involvement of potassium (K⁺) and chloride (Cl⁻) ion fluxes, as well as the movement of hydrogen ions (H⁺) through ion channels, leading to cytoplasmic acidification. These processes are crucial for maintaining ion homeostasis and promoting the activation of downstream signaling pathways. The activation of MAPKs triggers a cascade of phosphorylation events, leading to the modulation of transcription factors (TFs) within the nucleus, which regulate the expression of genes involved in secondary metabolite biosynthesis. The coordinated activation of these signaling pathways culminates in the production of secondary metabolites, which play essential roles in plant defense and stress adaptation. Enzyme activation further enhances these biosynthetic processes.",
"featured": true
}
]
},
{
"id": 11,
"slug": "280-1718510134",
"type": "original_article",
"manuscript_id": "280-1718510134",
"published": "2024-07-27",
"journal_reference": "Plant Trends. 2024; 2(3): 46-56",
"academic_editor": "Md Mahadi Hasan, PhD; Lanzhou University, China",
"cite_info": "Bhajan SK, Hasan MM, et al. An efficient approach of in vitro plant regeneration and propagation of mungbean [Vigna radiata L. (Wilczek)]. Plant Trends. 2024; 2(3): 46-56.",
"title": "An efficient approach of in vitro plant regeneration and propagation of mungbean [<span>Vigna radiata</span> L. (Wilczek)]",
"DOI": "10.5455/pt.2024.05",
"figures": [
{
"figure": "https://plant-trends.bsmiab.org/media/article_images/2024/34/28/280-1718510134-figure1.jpg",
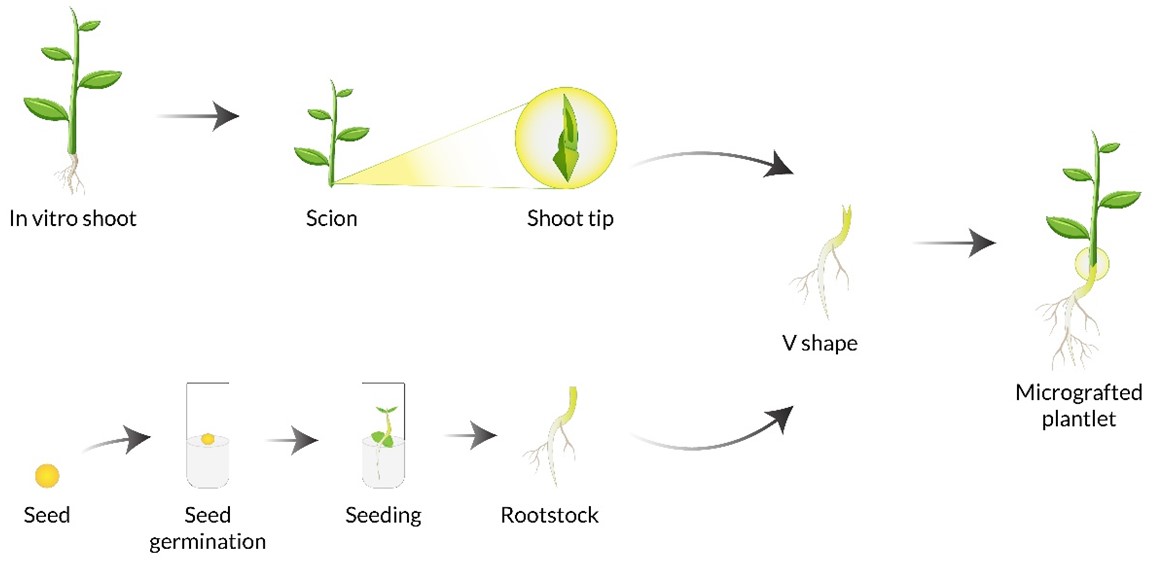
"caption": "Figure 1. Diagram illustrating the procedure of micrografting. Scions are derived from shoots that have been regenerated in vitro and then sliced into 'V' shapes. A seedling that has been grown in a laboratory setting and had its top part removed at the point where the stem emerges is shown to have the rootstock cut in a similar 'V' shape. The process of grafting shoot tips onto the rootstock is achieved through top grafting using masking tape. A micrografted plant has been successfully produced, and the circular marking marks the specific place where the micrograft has been performed.",
"featured": false
},
{
"figure": "https://plant-trends.bsmiab.org/media/article_images/2024/34/28/280-1718510134-figure2.jpg",
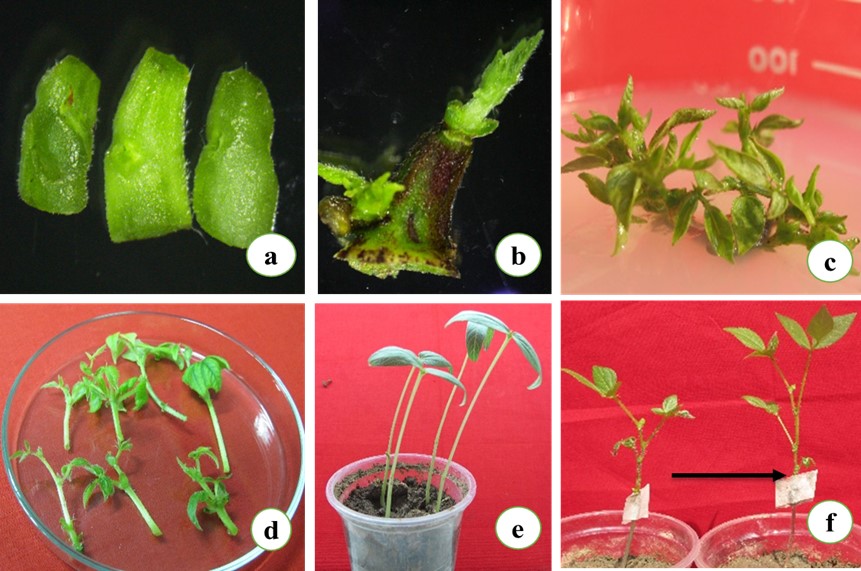
"caption": "Figure 2. In vitro regeneration of shoots and stages of micrografting in BARI Mung 3 variety. a) Cotyledonary node (CN) explants excised from 3-day-old in vitro grown seedlings. b) Initiation of in vitro shoots from CN explant. c) Multiple shoots developing from CN explant on MSB5 medium supplemented with 5.0 μM BAP. d) In vitro, raised shoots are used as scions for grafting. e) Seedlings prepared to use as rootstock for micrografting, and f) Successful micrografted plants after 33 days of grafting. Arrows indicate the grafted region covered by masking tape.",
"featured": true
},
{
"figure": "https://plant-trends.bsmiab.org/media/article_images/2024/34/28/280-1718510134-figure3.jpg",
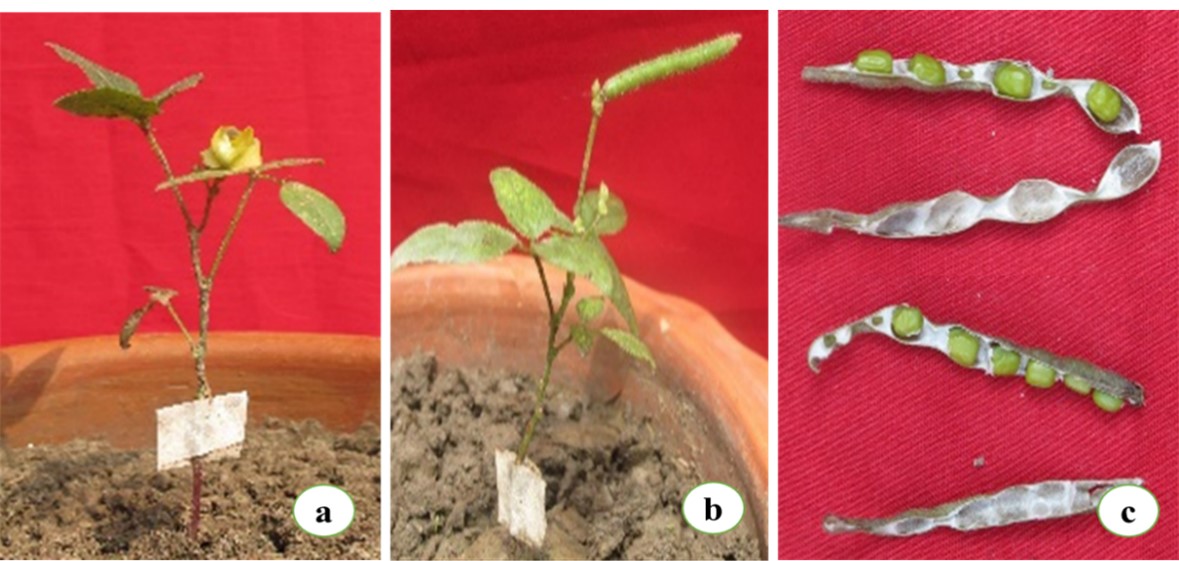
"caption": "Figure 3. Development of flowers and pods on micrografted plants of BARI Mung 3 variety. a) Flower developed on a grafted plant indicating the successful establishment of a grafted plant. b) Pod formation on micrografted plants. c) Several healthy seeds were obtained from pods developed on the micrografted plant of Mungbean.",
"featured": false
},
{
"figure": "https://plant-trends.bsmiab.org/media/article_images/2024/34/28/280-1718510134-figure4.jpg",
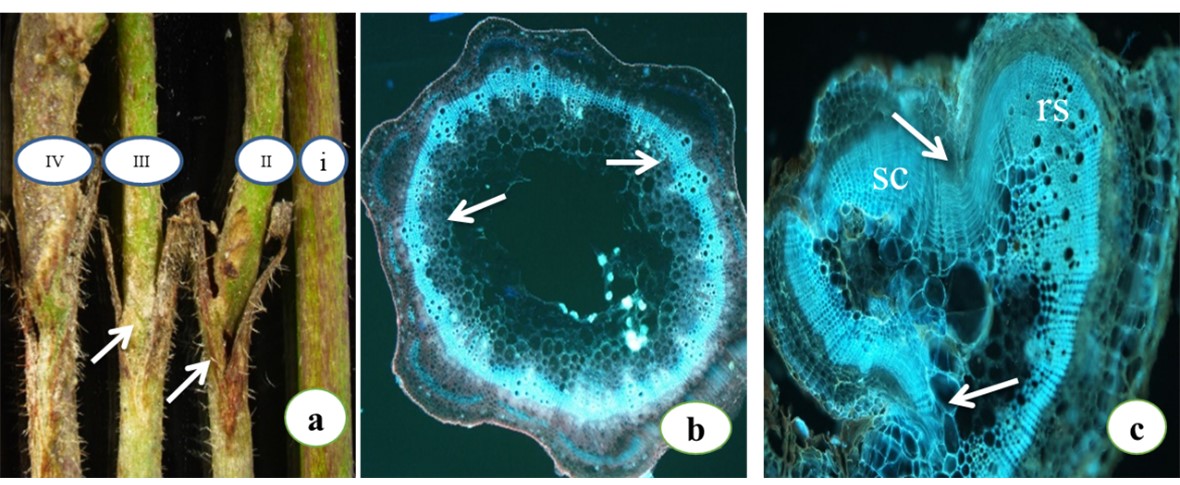
"caption": "Figure 4. Graft union and anatomy of graft formation. a) Various stages of graft union, i. a control shoot, ii. & iii showing stages of establishment of graft, iv. fully establish a micrografted region. Arrows indicate a developing grafted region. b) A fluorescent micrograph of a transverse section of a control shoot showing the position of vascular tissues (arrows). c) A fluorescent micrograph shows the connected vascular tissues (arrows) of the scion (sc) and rootstock (rs).",
"featured": false
}
]
},
{
"id": 7,
"slug": "280-1713330329",
"type": "original_article",
"manuscript_id": "280-1713330329",
"published": "2024-06-01",
"journal_reference": "Plant Trends. 2024; 2(2): 16-23",
"academic_editor": "Md Azizul Haque, PhD; Hajee Mohammad Danesh Science and Technology University, Bangladesh",
"cite_info": "Bagchi R, Diba SF, et al. Nitric oxide facilitates the activation of iron acquisition genes in soybean (Glycine max L.) exposed to iron deficiency. Plant Trends. 2024; 2(2): 16-23.",
"title": "Nitric oxide facilitates the activation of iron acquisition genes in soybean (<span>Glycine max</span> L.) exposed to iron deficiency",
"DOI": "10.5455/pt.2024.02",
"figures": [
{
"figure": "https://plant-trends.bsmiab.org/media/article_images/2024/25/04/280-1713330329-Figure1.jpg",
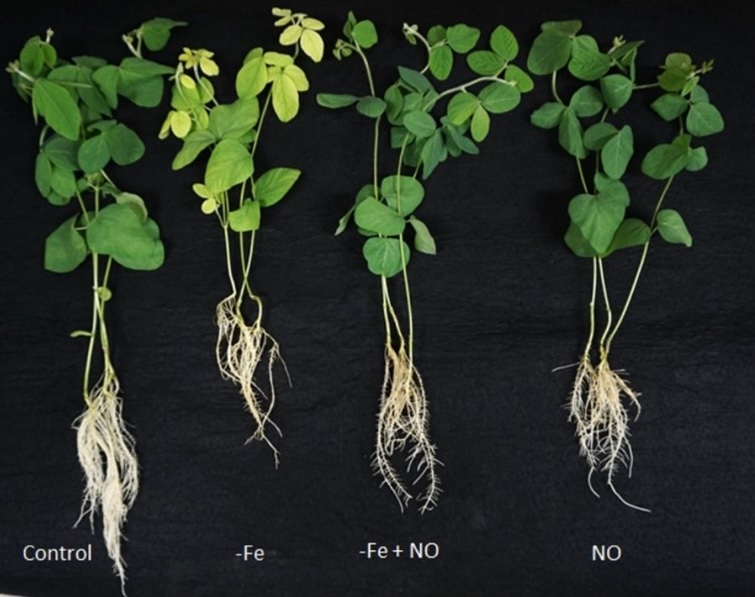
"caption": "Figure 1. Morphological alteration of soybean plants in response to 25 µM FeNaEDTA with all macro-micro element containing media (control); 0.1 µM FeNaEDTA (−Fe); 0.1 µM FeNaEDTA +sodium nitroprusside (100 µM) as nitric oxide (NO) donor (-Fe+NO); and 100 µM SNP treatment (NO).",
"featured": false
},
{
"figure": "https://plant-trends.bsmiab.org/media/article_images/2024/25/04/280-1713330329-Figure2.jpg",
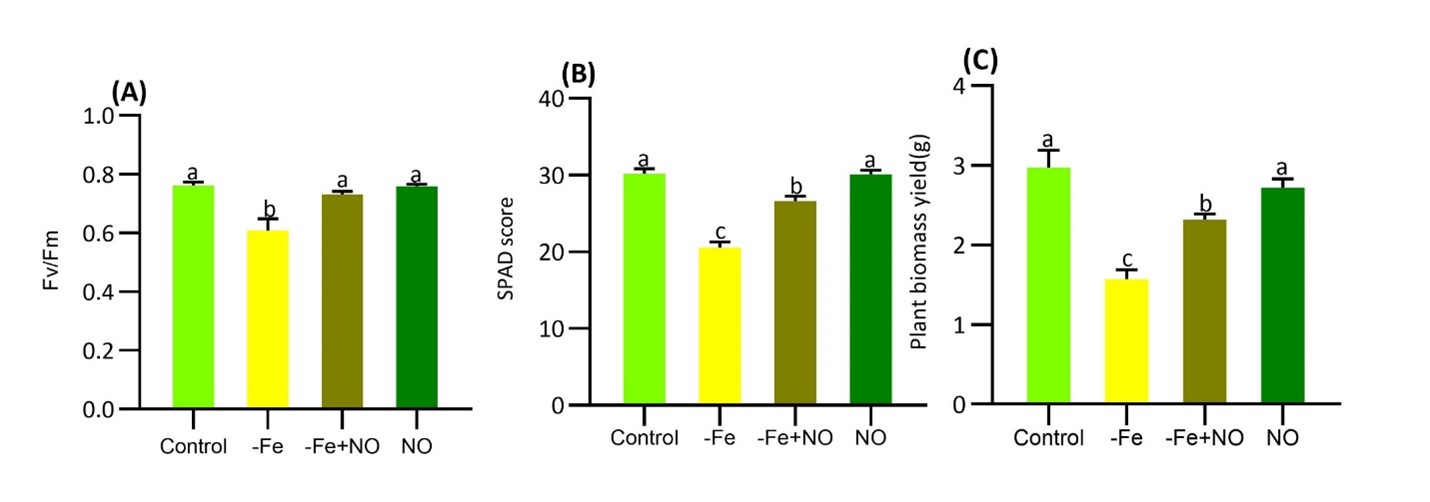
"caption": "Figure 2. Changes of physiological attributes soybean plants in response to 25 µM FeNaEDTA with all macro-micro element containing media (control); 0.1 µM FeNaEDTA (−Fe); 0.1 µM FeNaEDTA +sodium nitroprusside (100 µM) as nitric oxide (NO) donor (-Fe+NO); and 100 µM SNP treatment (NO). Fv/Fm (A), SPAD score (B), plant biomass yield (C). Data represents ± SD of three independent biological samples. Different letters above on bar columns indicate significant difference at P < 0.05 level.",
"featured": false
},
{
"figure": "https://plant-trends.bsmiab.org/media/article_images/2024/25/04/280-1713330329-Figure3.jpg",
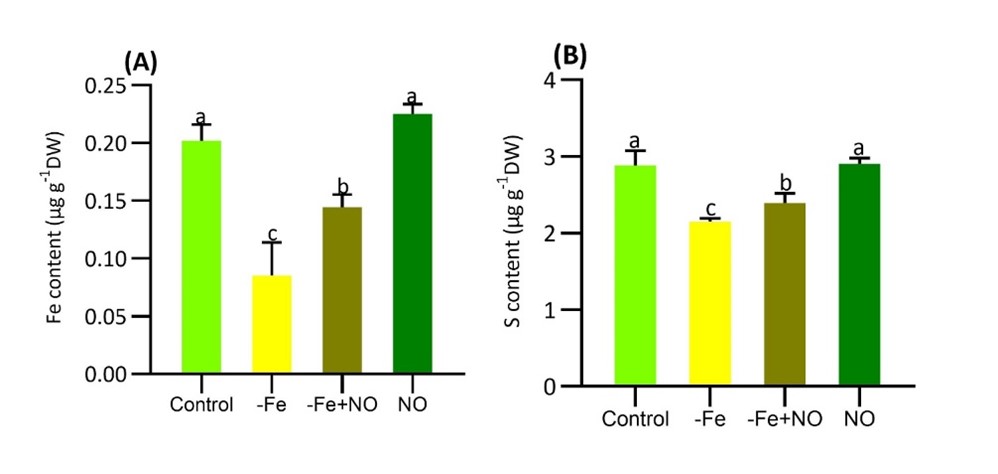
"caption": "Figure 3. Alteration of iron (Fe) and sulfur (s) content in soybean plants in response to 25 µM FeNaEDTA with all macro-micro element containing media (control); 0.1 µM FeNaEDTA (−Fe); 0.1 µM FeNaEDTA +sodium nitroprusside (100 µM) as nitric oxide (NO) donor (-Fe+NO); and 100 µM SNP treatment (NO). Fe content (A), S content (B). Data represents ± SD of three independent biological samples. Different letters above on bar columns indicate significant difference at P < 0.05 level.",
"featured": false
},
{
"figure": "https://plant-trends.bsmiab.org/media/article_images/2024/25/04/280-1713330329-Figure4.jpg",
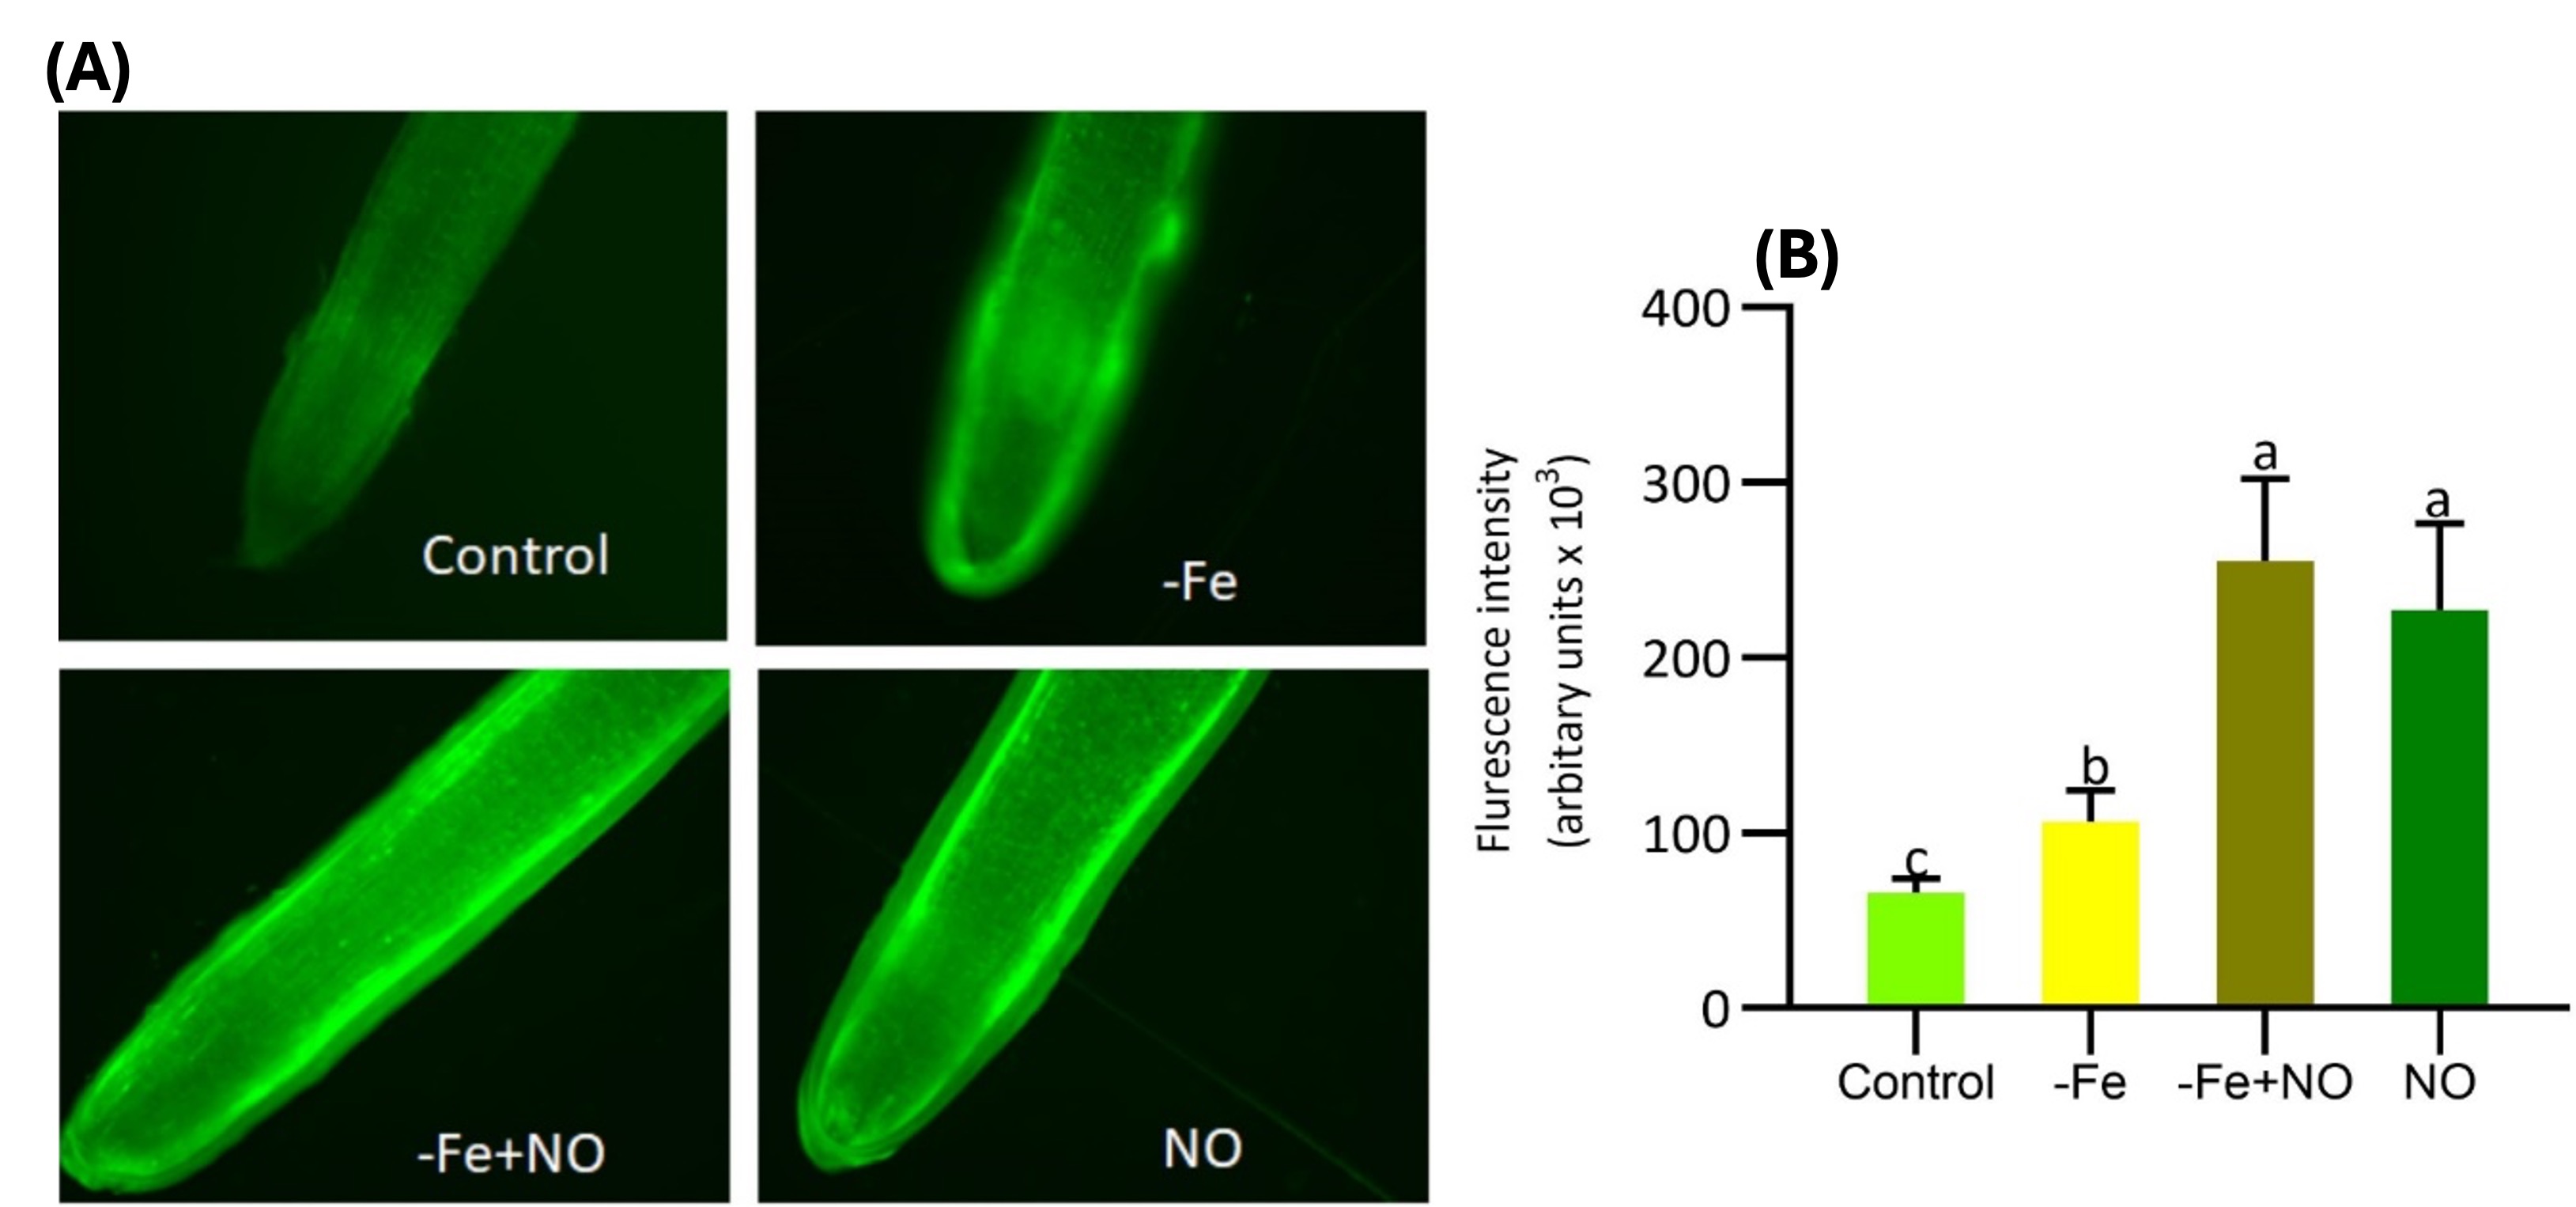
"caption": "Figure 4. Fluorescence intensity of nitric oxide (NO) in soybean root tips in response to 25 µM FeNaEDTA with all macro-micro element containing media (control); 0.1 µM FeNaEDTA (−Fe); 0.1 µM FeNaEDTA +sodium nitroprusside (100 µM) as nitric oxide (NO) donor (-Fe+NO); and 100 µM SNP treatment (NO). NO intensity shows in soybean root tips under different treatments (A), presentation of fluorescence intensity of NO (B). Data represents ± SD of three independent biological samples. Different letters above on bar columns indicate significant difference at P < 0.05 level.",
"featured": true
},
{
"figure": "https://plant-trends.bsmiab.org/media/article_images/2024/25/04/280-1713330329-Figure5.jpg",
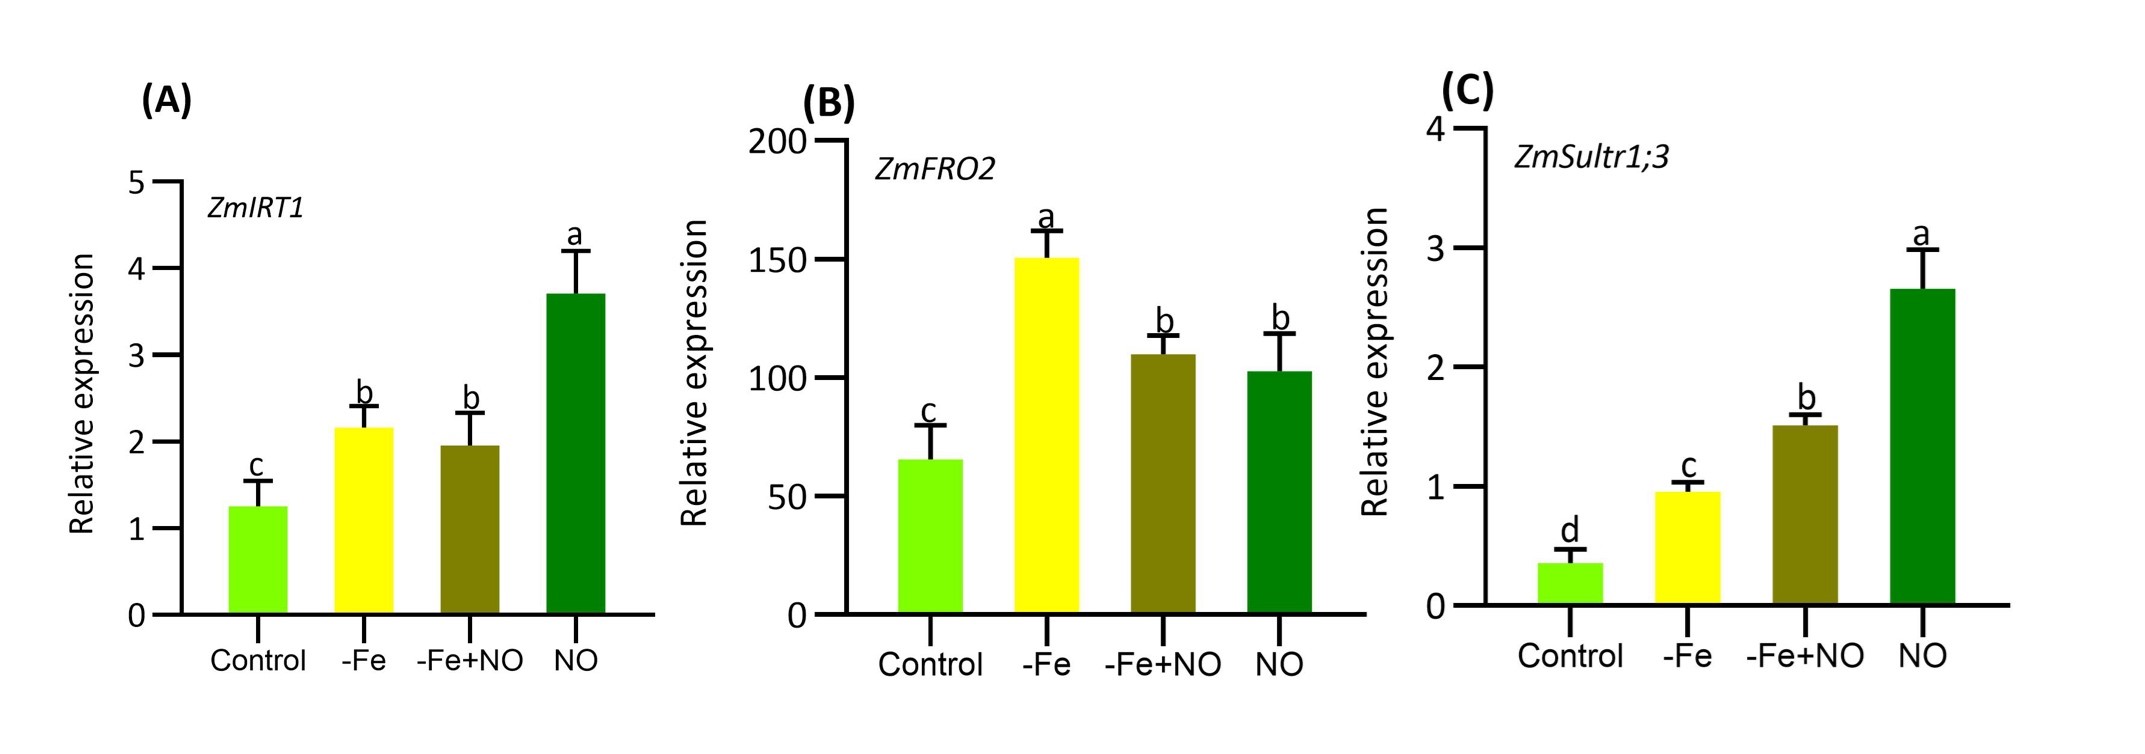
"caption": "Figure 5. Expression of key genes involved in Fe-acquisition and homeostasis in soybean in response to 25 µM FeNaEDTA with all macro-micro element containing media (control); 0.1 µM FeNaEDTA (−Fe); 0.1 µM FeNaEDTA +sodium nitroprusside (100 µM) as nitric oxide (NO) donor (-Fe+NO); and 100 µM SNP treatment (NO). ZmIRT1 (A), ZmFRO2 (B), and ZmSultr1;3 (C). Data represents ± SD of three independent biological samples. Different letters above on bar columns indicate significant difference at P <0.05 level.",
"featured": false
},
{
"figure": "https://plant-trends.bsmiab.org/media/article_images/2024/25/04/280-1713330329-Figure6.jpg",
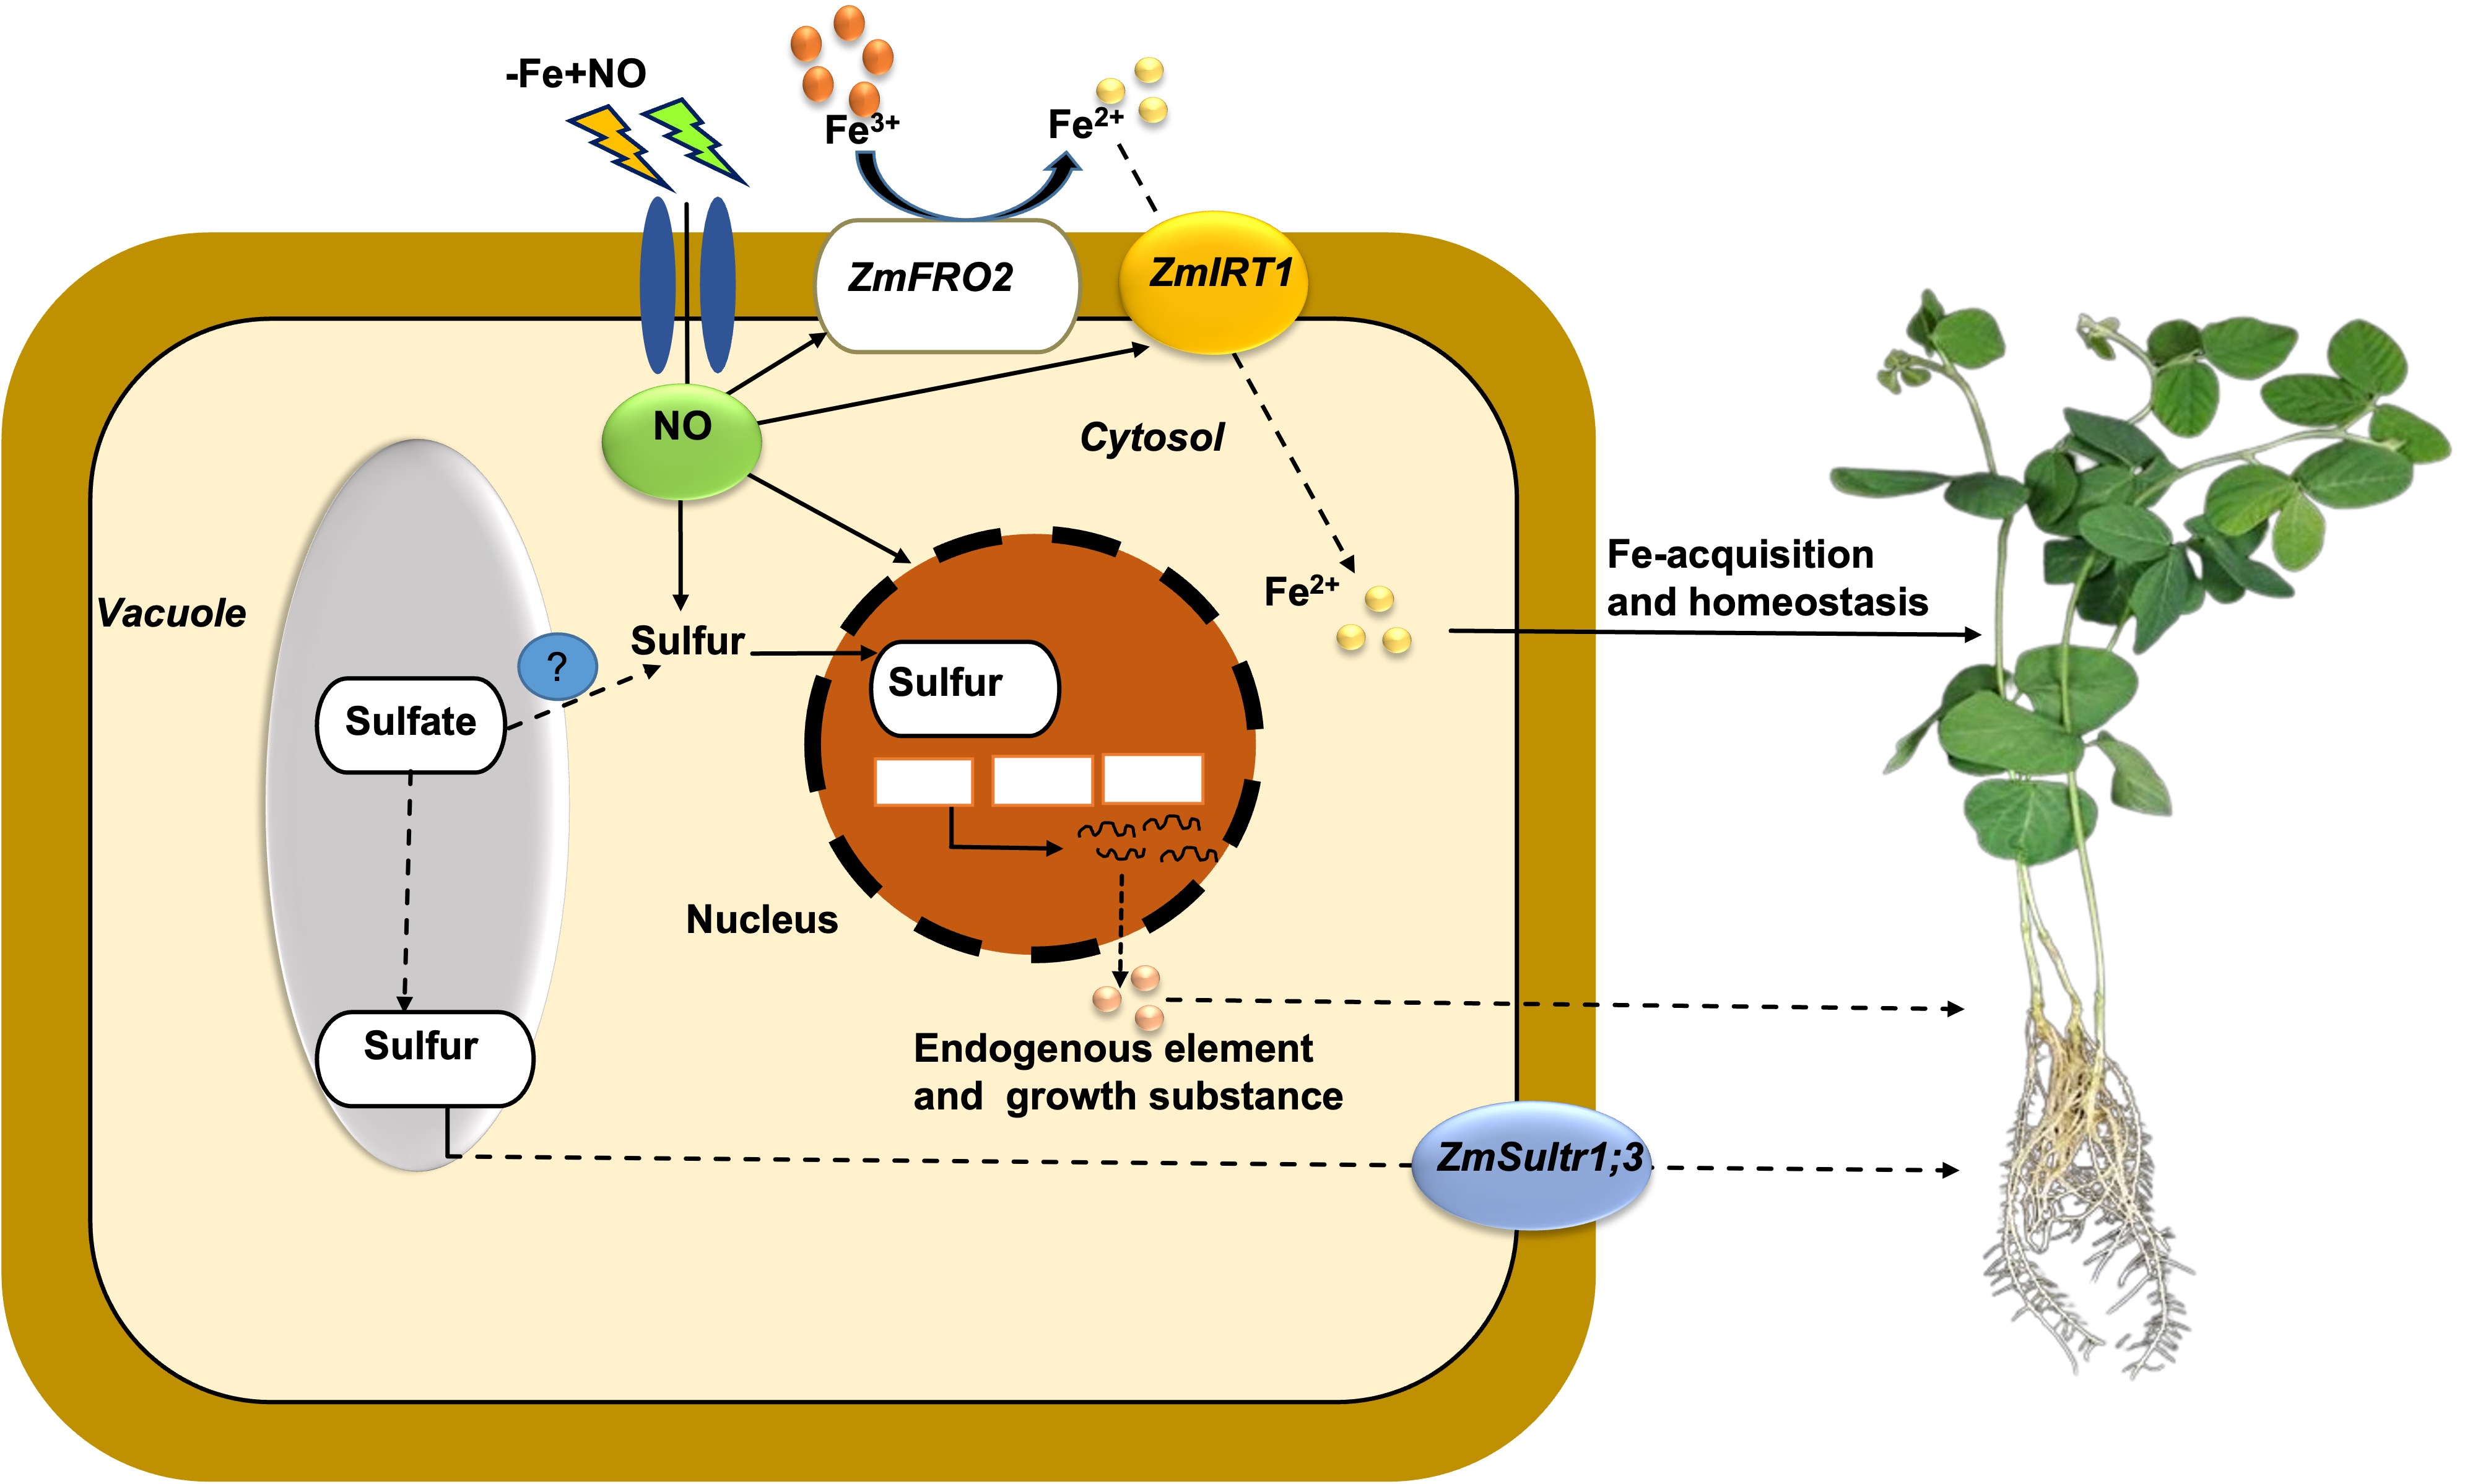
"caption": "Figure 6. Mechanistic overview of nitric oxide (NO) involving Fe-acquisition and homeostasis in soybean. The NO played a key frontier in inducing candidate genes ZmIRT1, ZmFRO2, and ZmSultr1;3. The ZmIRT1 is involved in the conversion of ferric (Fe3+) into ferrous (Fe2+) in root cells which further leads to Fe-acquisition and homeostasis in soybean. On the other side, NO enhances the accumulation of sulfur (S) through the sulfate transporter ZmSultr1;3. The whole system combinedly enhanced Fe-acquisition and homeostasis in Strategy I soybean plants.",
"featured": false
}
]
},
{
"id": 4,
"slug": "280-1704712929",
"type": "original_article",
"manuscript_id": "280-1704712929",
"published": "2023-12-24",
"journal_reference": "Plant Trends. 2023; 1(1): 20-30",
"academic_editor": "Tinashe Zenda, PhD;\r\nHebei Agricultural University, China",
"cite_info": "Hasan R, Rahman MA, et al. RAPD-markers assisted genetic diversity analysis and Bt-Cry1Ac gene identification in eggplant (Solanum melongena L.). Plant Trends. 2023; 1(1): 20-30.",
"title": "RAPD-markers assisted genetic diversity analysis and <span>Bt-Cry1Ac</span> gene identification in eggplant (<span>Solanum melongena</span> L.)",
"DOI": "10.5455/pt.2023.03",
"figures": [
{
"figure": "https://plant-trends.bsmiab.org/media/article_images/2024/54/25/PT-2024-01-Figure1.jpg",
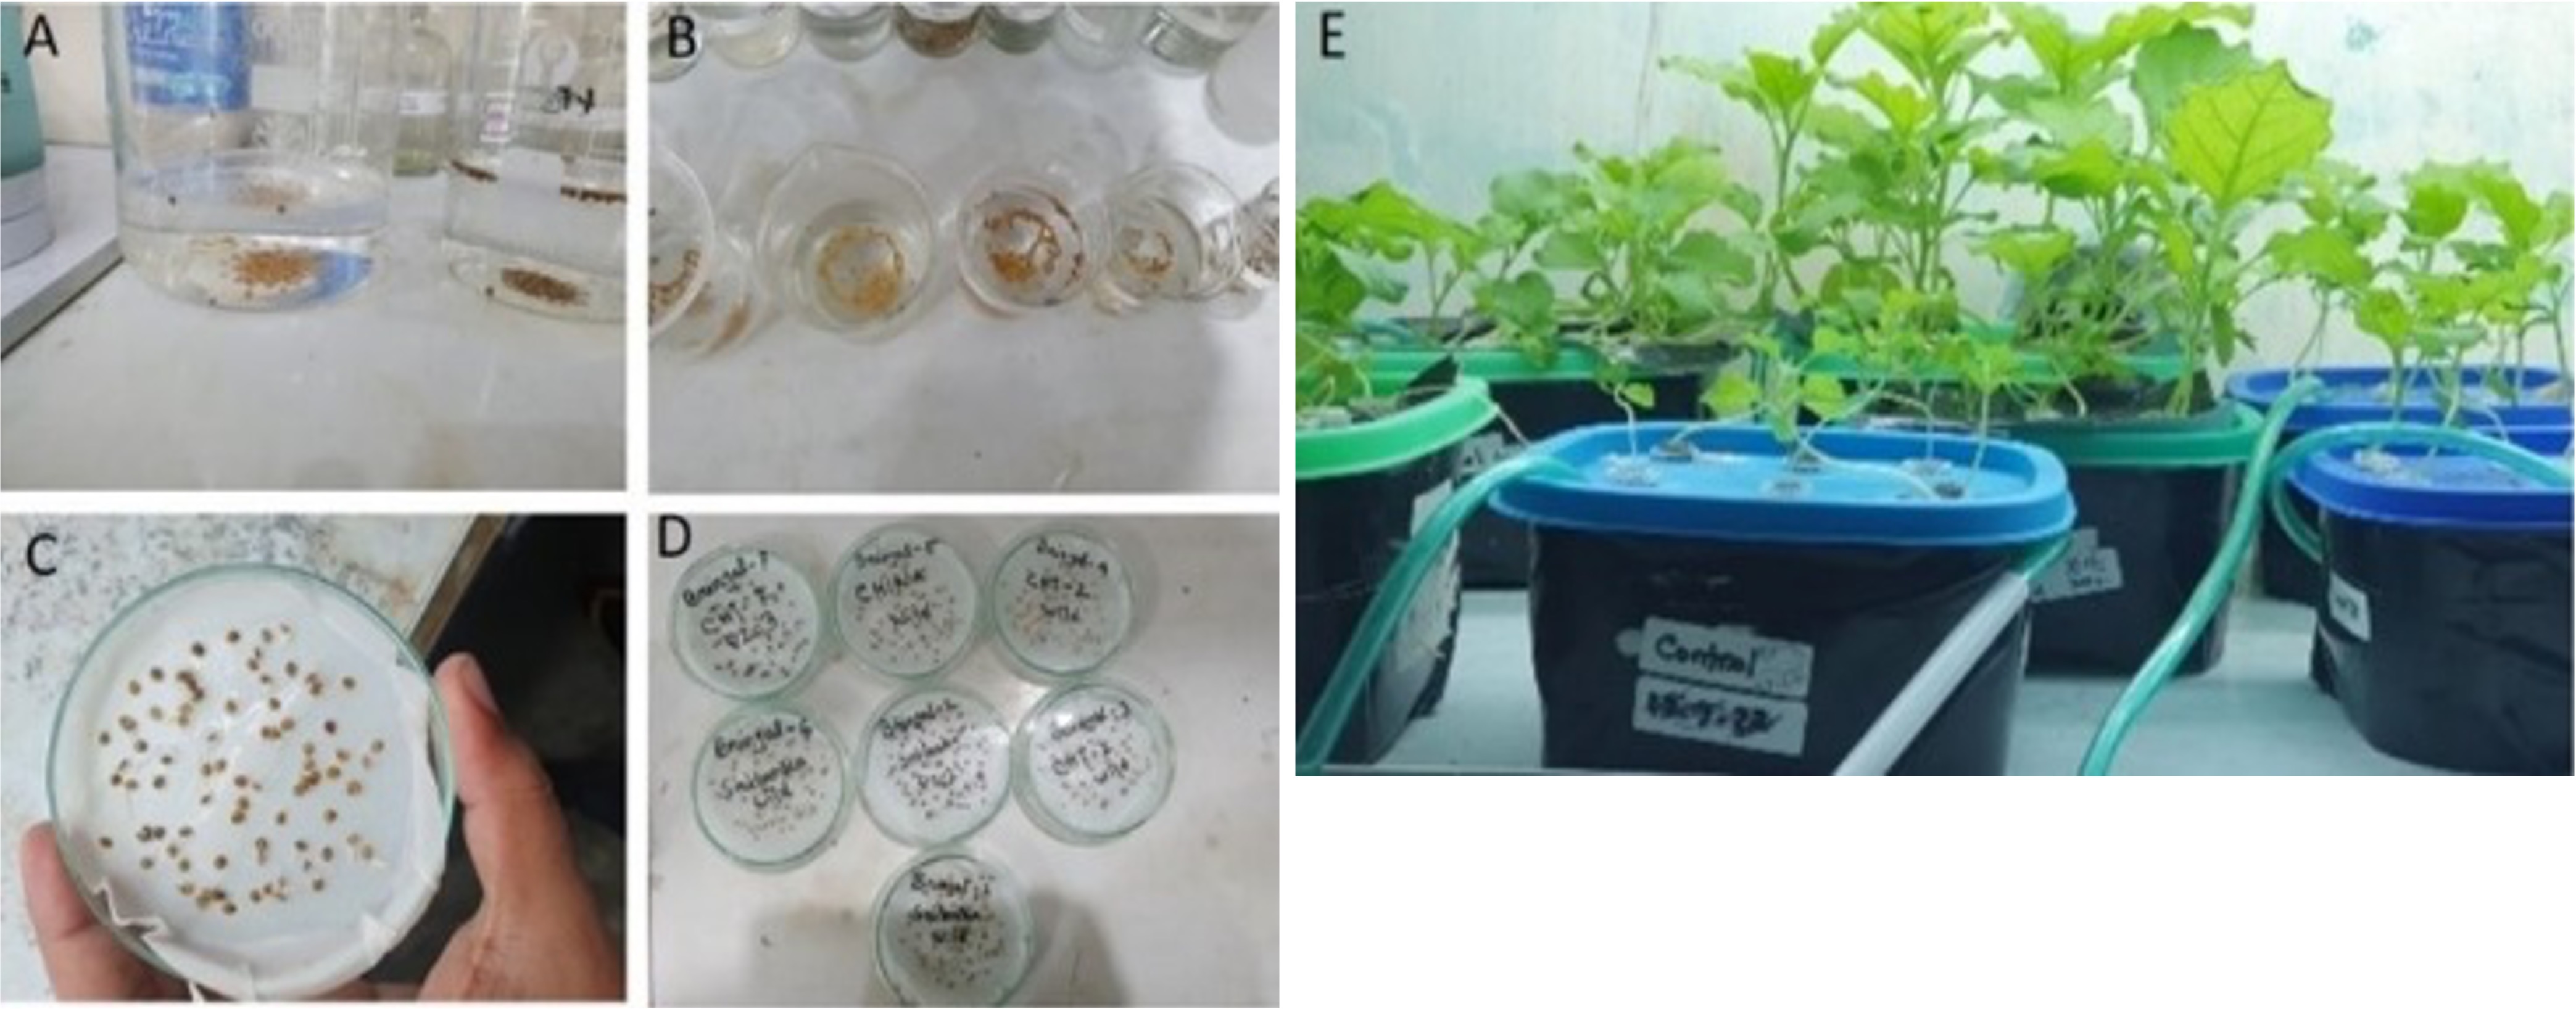
"caption": "Figure 1. Different steps of eggplant growing. Eggplant seed sterilization (A-B), germination of seeds (C-D), and eggplants growing in hydroponic culture (E). The seven eggplant varieties were grown and prepared for DNA isolation.",
"featured": true
},
{
"figure": "https://plant-trends.bsmiab.org/media/article_images/2024/55/25/PT-2024-01-Figure2.jpg",
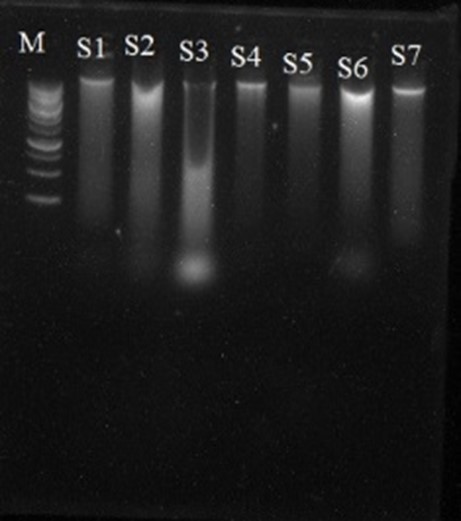
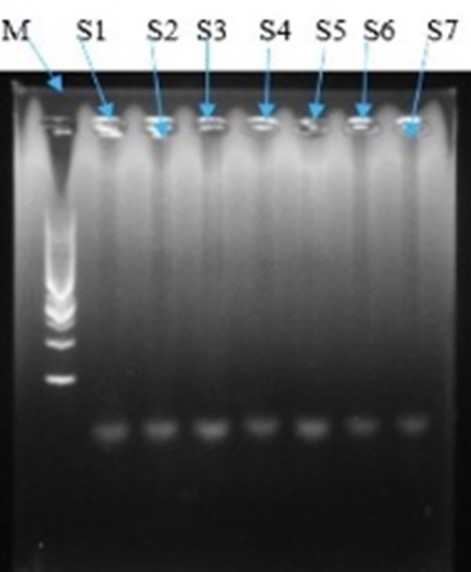
"caption": "Figure 2. Visualization of extracted genomic DNA band on 1% agarose gel. The 1kb plus DNA ladder represents DNA marker ranging from 0.5 kb to 10 kb. The numeric S1 to S7 show sample number of 7 eggplant varieties.",
"featured": false
},
{
"figure": "https://plant-trends.bsmiab.org/media/article_images/2024/55/25/PT-2024-01-Figure3.jpg",
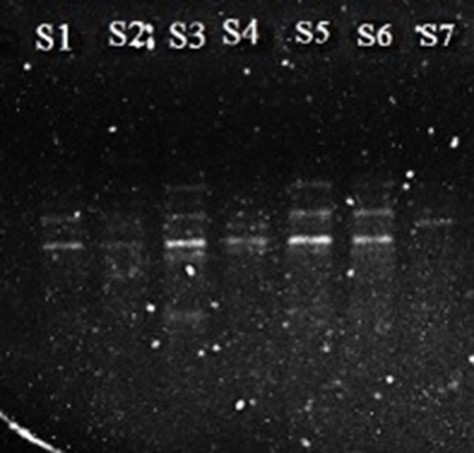
"caption": "Figure 3. Visualization of samples 1-7 using OPA-02 primer. The numeric S1 to S7 shows a sample number of 7 eggplant varieties.",
"featured": false
},
{
"figure": "https://plant-trends.bsmiab.org/media/article_images/2024/55/25/PT-2024-01-Figure4.jpg",
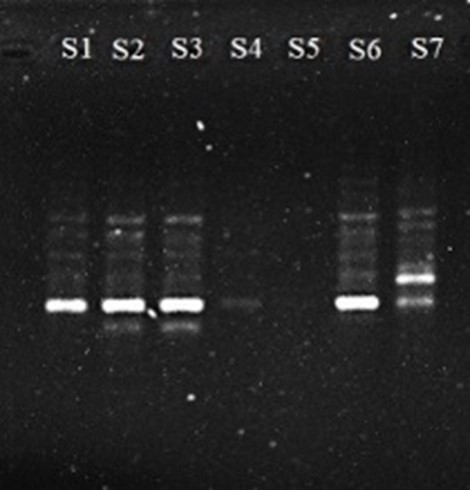
"caption": "Figure 4. Visualization of samples 1-7 using OPA-04 primer. The numeric S1 to S7 shows a sample number of 7 eggplant varieties.",
"featured": false
},
{
"figure": "https://plant-trends.bsmiab.org/media/article_images/2024/55/25/PT-2024-01-Figure5.jpg",
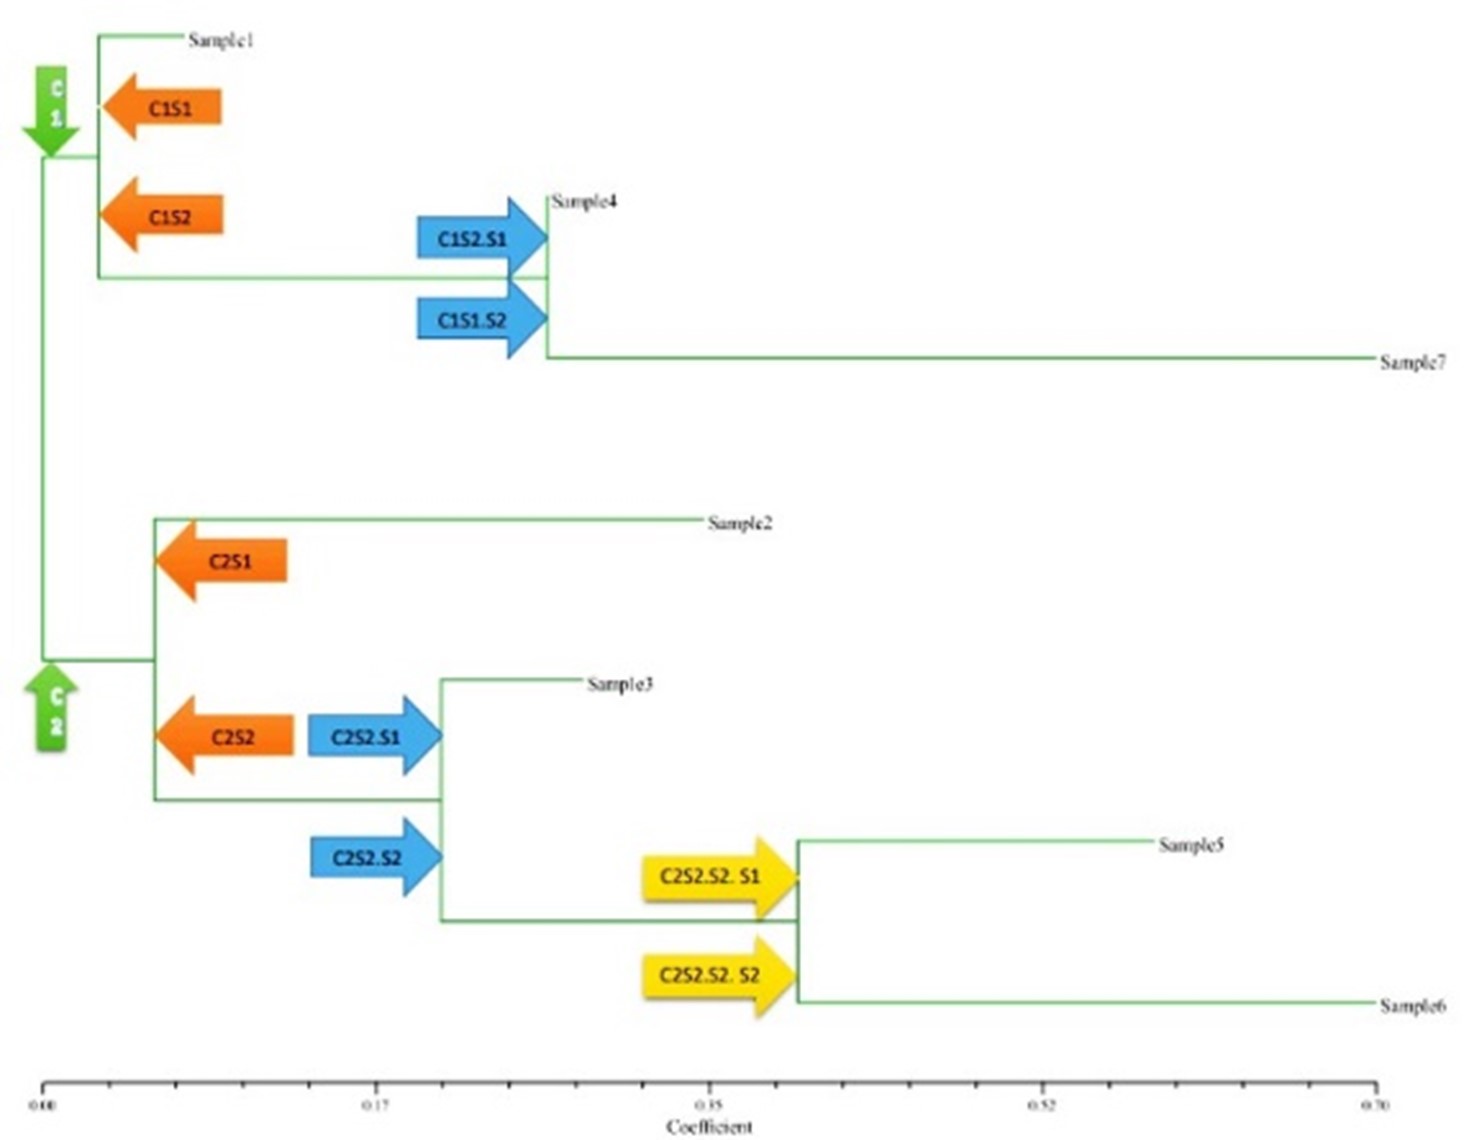
"caption": "Figure 5. UPGMA dendrogram showing clustering of 7 eggplant varieties based on two RAPD primers.",
"featured": false
},
{
"figure": "https://plant-trends.bsmiab.org/media/article_images/2024/55/25/PT-2024-01-Figure6.jpg",
"caption": "Figure 6. PCR amplification result of Bt-Cry1Ac gene in 7 eggplant varieties. The DNA ladder represents DNA markers ranging from 0.1 kb to 10kb. The numeric S1 to S7 shows a sample number of 7 eggplant varieties.",
"featured": false
}
]
},
{
"id": 1,
"slug": "280-1703399757",
"type": "commentary",
"manuscript_id": "280-1703399757",
"published": "2023-12-22",
"journal_reference": "Plant Trends. 2023; 1(1): 16-19",
"academic_editor": "Swapan Kumar Roy, PhD;\r\nIUBAT—International University of Business Agriculture and Technology, Bangladesh",
"cite_info": "Hasan MM, Jahan MS. Dual benefits: MOT1;1/1;2 coordinates both crop growth and productivity. Plant Trends. 2023; 1(1): 16-19.",
"title": "Dual benefits: <span>MOT1;1/1;2</span> coordinates both crop growth and productivity",
"DOI": "10.5455/pt.2023.02",
"figures": [
{
"figure": "https://plant-trends.bsmiab.org/media/article_images/2024/09/05/PT-2023-02-Figure1.jpg",
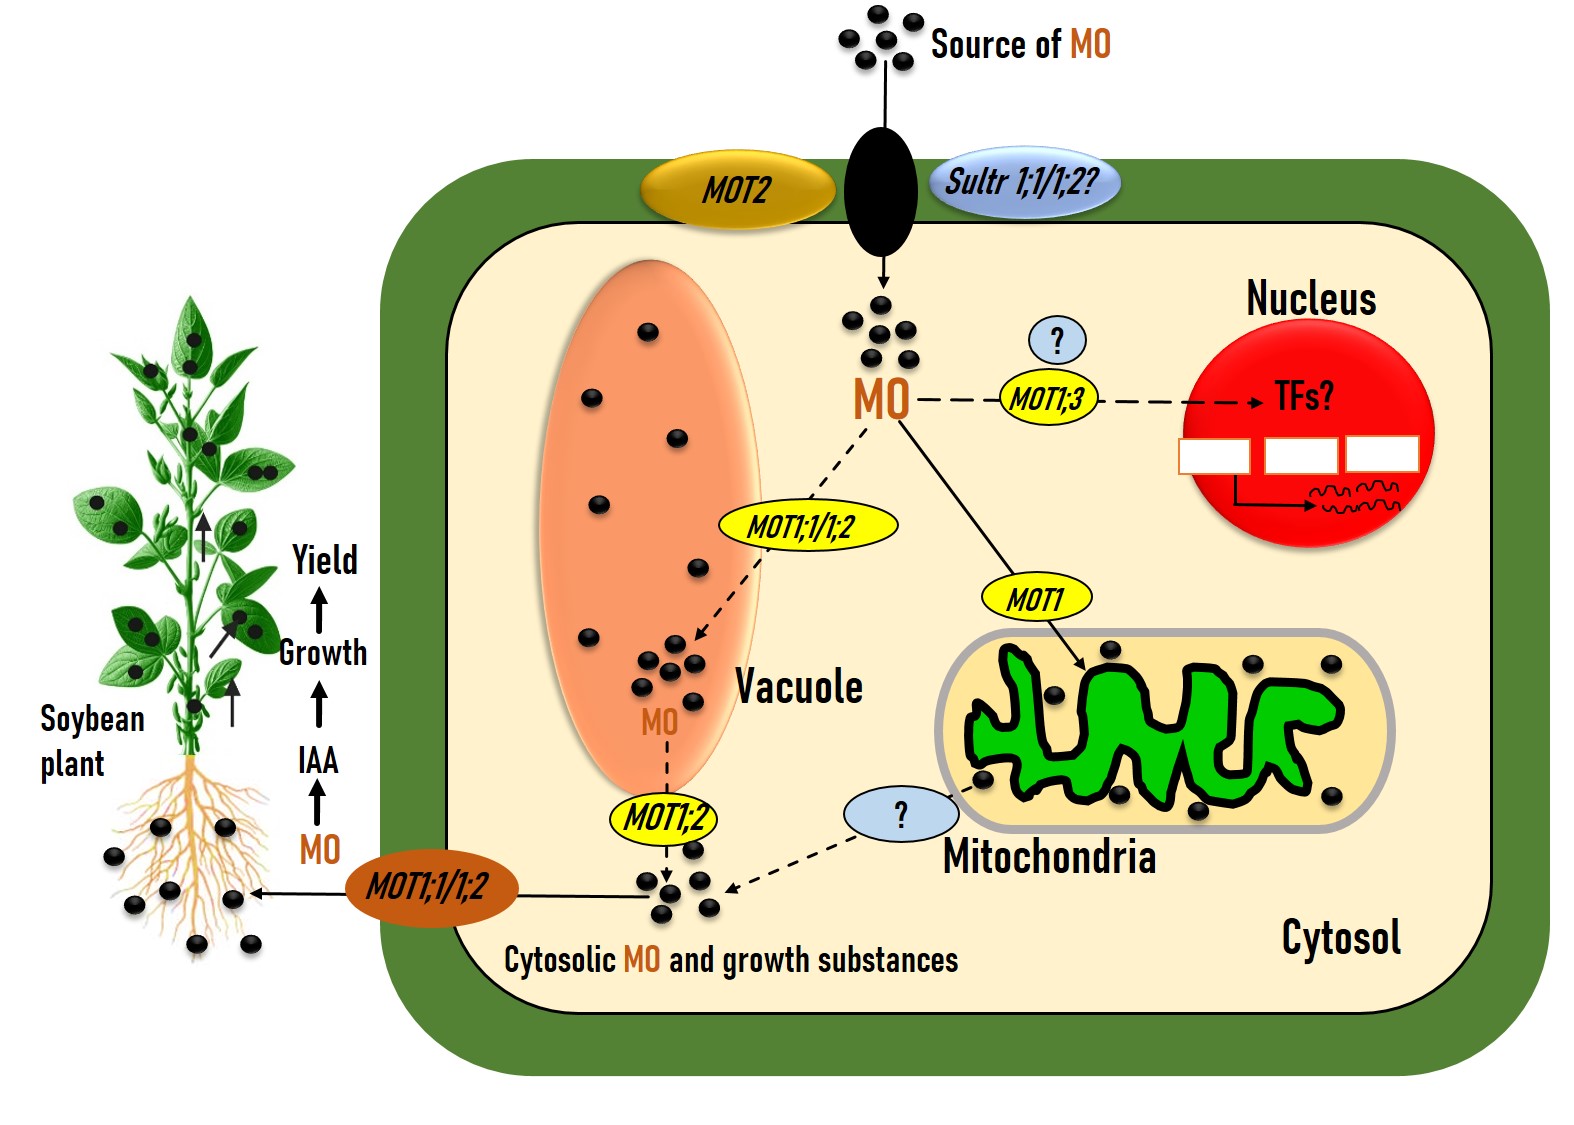
"caption": "Figure 1. Working model of MOT1;1/1;2-involving regulation into cells leading growth and yield traits in plants. The Mo is transported into mitochondria via MOT1;1, subsequently MOT1;2 export Mo from vacuole into cytosol. The cytosolic Mo further transported out of the cells for long distance transport to shoots, leaves and grains. The black dots in the figures indicates form of molybdenum. Abbreviation, Mo, molybdenum, MOT2, molybdate transporter family 2 proteins, Sultr, sulfur transporter, IAA, indole-3-acetic acid; TF, transcription factor. The dotted lines indicate the possible mechanism of Mo regulation.",
"featured": true
}
]
},
{
"id": 3,
"slug": "280-1702517397",
"type": "review_article",
"manuscript_id": "280-1702517397",
"published": "2023-12-21",
"journal_reference": "Plant Trends. 2023; 1(1): 1-15",
"academic_editor": "Monirul Islam, PhD; University of Massachusetts Amherst, Amherst, USA",
"cite_info": "Azad MAK, Barwal SK, et al. Exploring impact of integrated breeding strategies in enhancing yield, nutritional quality, and stress tolerance in alfalfa. Plant Trends. 2023; 1(1): 1-15.",
"title": "Exploring impact of integrated breeding strategies in enhancing yield, nutritional quality, and stress tolerance in alfalfa",
"DOI": "10.5455/pt.2023.01",
"figures": [
{
"figure": "https://plant-trends.bsmiab.org/media/article_images/2023/54/27/Figure_1.jpg",
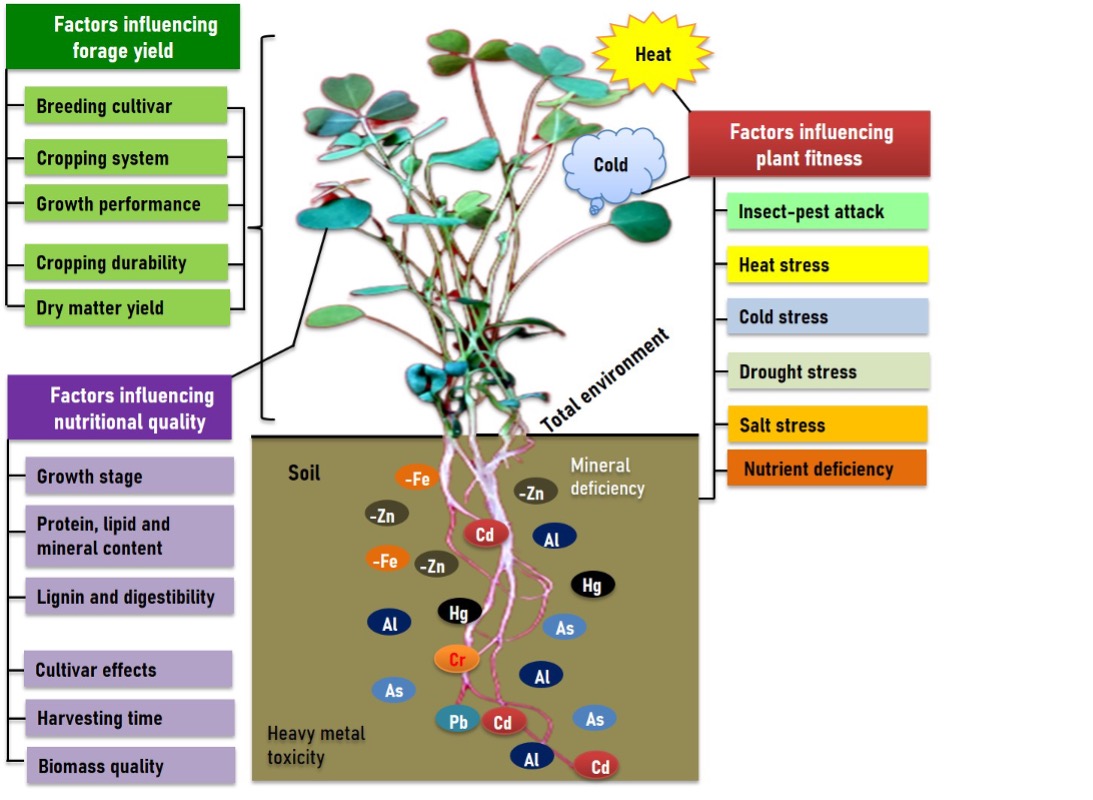
"caption": "Figure 1. Environmental factors influencing yield, nutritional quality, and plant fitness in alfalfa. Abbreviation, -Zn, zinc deficiency; -Fe, iron deficiency; Al, aluminium, Cr, chromium; Cd, cadmium; Hg, mercury, As, arsenic, and Pb, lead.",
"featured": false
},
{
"figure": "https://plant-trends.bsmiab.org/media/article_images/2023/54/27/Figure2.jpg",
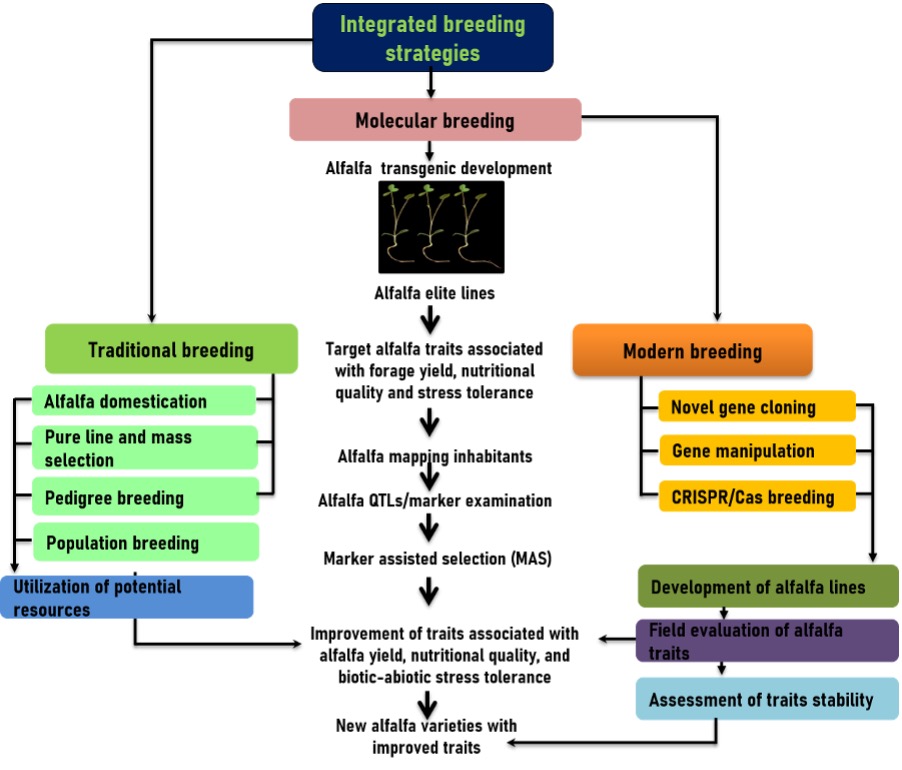
"caption": "Figure 2. Illustration of integrated breeding strategies for developing traits in alfalfa associated with forage yield, nutritional quality and biotic-abiotic stress tolerance in alfalfa.",
"featured": false
},
{
"figure": "https://plant-trends.bsmiab.org/media/article_images/2023/54/27/Figure3.jpg",
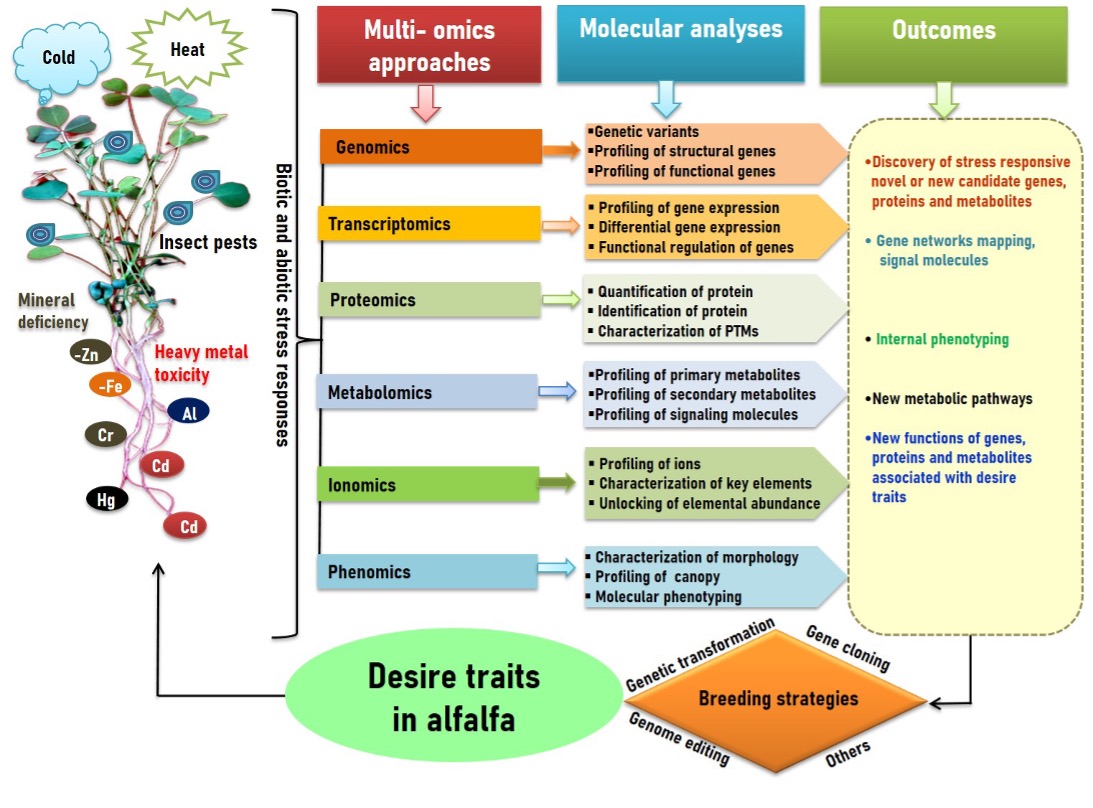
"caption": "Figure 3. Multi-omics approches for developing desire traits in alfalfa. Abbreviation, -Zn, zinc deficiency; -Fe, iron deficiency; Al, aluminium, Cr, chromium; Cd, cadmium; and Hg, murcury.",
"featured": true
},
{
"figure": "https://plant-trends.bsmiab.org/media/article_images/2023/54/27/Figure4.jpg",
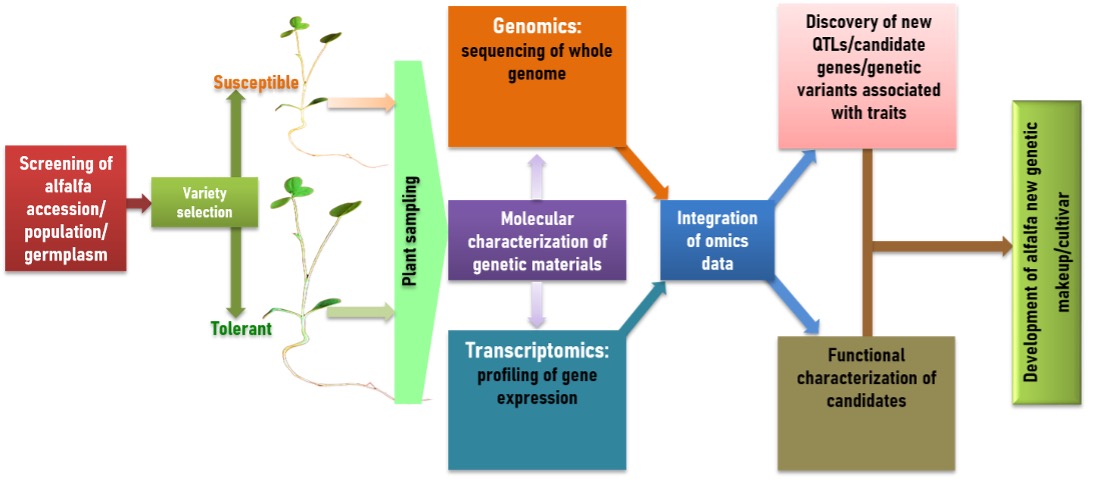
"caption": "Figure 4. Illustration of working model for developing new alfalfa cultivar from unutilized alfalfa germplasm. Abbreviation, QTL, quantitative trade loci.",
"featured": false
}
]
}
]